Full Report
The numbers behind Penumbra, Inc.: as-reported financial statements and company metrics for FY2021–FY2025, traced to the source filings, opened with the share-price history those statements have to justify. Every linked figure opens the exact page of the filing it was printed on, with the statement row highlighted. Amounts in US$ thousands unless noted.
Reading notes: All figures in thousands of US dollars, as printed in Penumbra's SEC filings ('in thousands, except share and per share amounts'). Citation filings: FY2025/FY2024/FY2023 columns cite the FY2025 Form 10-K (3-year statements); FY2022/FY2021 income, cash-flow and revenue cite the FY2023 Form 10-K; FY2021 balance sheet cites the FY2021 Form 10-K (the FY2023 10-K balance sheet prints only FY2023/FY2022). Revenue disaggregation uses the company's Thrombectomy / Embolization and Access product cut (available for all of FY2021-FY2025); a Revenue by Geography table (United States / International) is shown alongside. The older Vascular / Neuro cut was retired and is not shown. FY2016-FY2018 long-term figures are from the standardized data feed (SEC XBRL) and are shown without page links; FY2016-FY2018 total revenue is feed cost-of-revenue plus feed gross profit. FY2019-FY2020 long-term figures are cited to the FY2021 Form 10-K.
Share Price — Full Available History — 11 Years
The stock closed at $321.19 on Jul 31, 2026 — up 678% over the window shown (+20.8% a year), trading between $36.50 and $359.40. At that close the stock trades at 71× FY2025 diluted EPS as reported below.
Source: market price feed, weekly closes, sampled from 2,733 source observations, Sep 2015–Jul 2026. Price return only, excludes dividends.
Market capitalization $12.6bn.
Market cap = 39.3M shares outstanding × the Jul 31, 2026 close of $321.19. Market-derived, shown without filing links.
FY2025 at a Glance
Net income (US$ thousands)
Diluted EPS
Source: FY2025 consolidated statements [1] [2]. Click any linked figure to open the filing page with the row highlighted.
Revenue by Product Category
| Revenue by Product Category | FY2021 | FY2022 | FY2023 | FY2024 | FY2025 |
|---|---|---|---|---|---|
| Thrombectomy | 437,775 | 511,137 | 677,343 | 815,475 | 947,918 |
| Embolization and Access | 309,815 | 335,996 | 381,179 | 379,140 | 455,747 |
| Total revenue | 747,590 | 847,133 | 1,058,522 | 1,194,615 | 1,403,665 |
| Total revenue growth, derived | — | +13.3% | +25.0% | +12.9% | +17.5% |
Source: Form 10-K revenue disaggregation footnote (Thrombectomy / Embolization and Access) [3] [4]. Click any linked figure to open the filing page with the row highlighted.
Income Statement
Source: Consolidated Statements of Operations [1] [2]. Click any linked figure to open the filing page with the row highlighted.
Columns marked E are consensus analyst estimates from S&P Capital IQ (CapIQ), shown alongside reported results for direct comparison; they are not company guidance.
Estimate source: S&P Capital IQ (CapIQ) consensus, as of 2026-08-03. Estimate figures are S&P Capital IQ consensus (vendor data — no filing page links). EPS and net income use the normalized (adjusted) consensus where the street reports it. Line-item analyst models (segments, drivers, KPIs) are in the Visible Alpha tab.
Balance Sheet
Source: Consolidated Balance Sheets [5] [6] [7]. Click any linked figure to open the filing page with the row highlighted.
Cash Flow
Source: Consolidated Statements of Cash Flows [8] [9]. Click any linked figure to open the filing page with the row highlighted.
Revenue by Geography
| Revenue by Geography | FY2021 | FY2022 | FY2023 | FY2024 | FY2025 |
|---|---|---|---|---|---|
| United States | 527,789 | 591,715 | 757,151 | 902,067 | 1,091,761 |
| International | 219,801 | 255,418 | 301,371 | 292,548 | 311,904 |
| Total revenue | 747,590 | 847,133 | 1,058,522 | 1,194,615 | 1,403,665 |
Source: Form 10-K revenue disaggregation footnote (destination of shipment) [3] [4]. Click any linked figure to open the filing page with the row highlighted.
Margins Operating Leverage (% of revenue, as MD A reports)
| Margins Operating Leverage (% of revenue, as MD A reports) | FY2021 | FY2022 | FY2023 | FY2024 | FY2025 |
|---|---|---|---|---|---|
| Gross margin % | 63.6% | 63.2% | 64.5% | 63.2% | 67.1% |
| R D as a percentage of revenue | 14.0% | 9.4% | 8.0% | 7.9% | 6.4% |
| SG A as a percentage of revenue | 50.6% | 53.1% | 47.8% | 48.0% | 47.3% |
| Operating margin (income from operations, % of revenue) | (1.0%) | 0.7% | 6.9% | 0.8% | 13.5% |
Source: company filings [10] [11]. Click any linked figure to open the filing page with the row highlighted.
Stock-Based Compensation by Function
| Stock-Based Compensation by Function | FY2021 | FY2022 | FY2023 | FY2024 | FY2025 |
|---|---|---|---|---|---|
| Cost of sales | 2,898 | 3,882 | 5,330 | 4,158 | 3,501 |
| Research and development | 30,037 | 5,908 | 8,838 | 6,868 | 9,749 |
| Sales, general and administrative | 32,828 | 27,588 | 36,348 | 35,138 | 45,963 |
Source: company filings [12] [13]. Click any linked figure to open the filing page with the row highlighted.
Tax, Distribution Channel Workforce
| Tax, Distribution Channel Workforce | FY2021 | FY2022 | FY2023 | FY2024 | FY2025 |
|---|---|---|---|---|---|
| Effective tax rate | 125.0% | 151.4% | (14.2%) | 32.9% | 13.4% |
| Sales to distributors (% of revenue) | 16.6% | 18.7% | 16.7% | 13.2% | 10.0% |
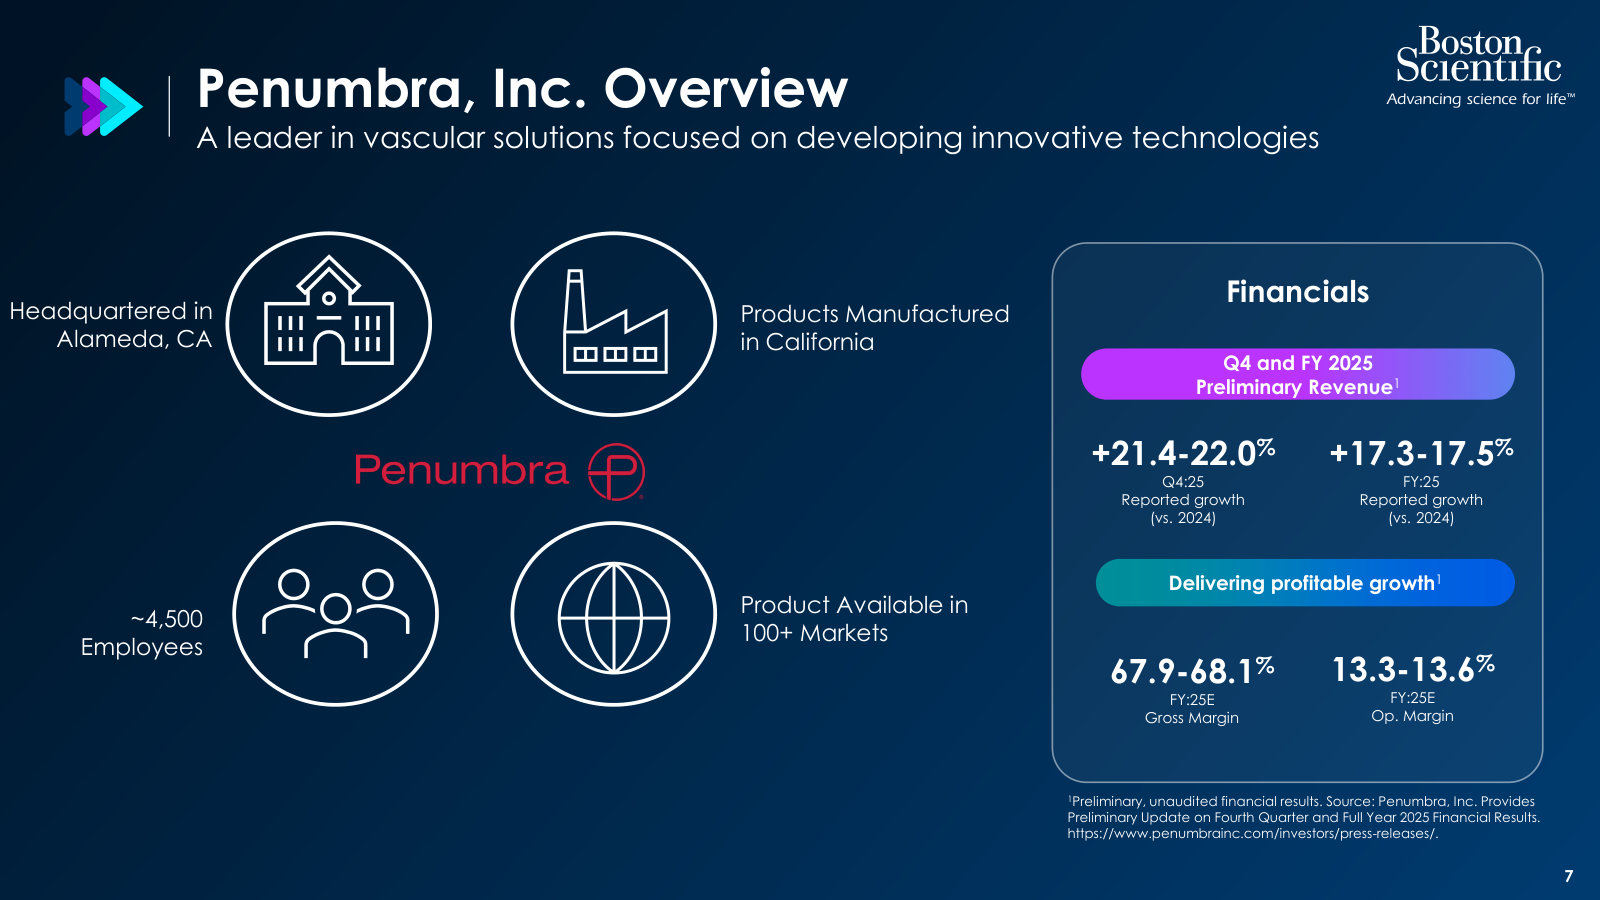
| Employees worldwide | 3,800 | 3,900 | 4,200 | 4,500 | 4,700 |
| Advertising costs | — | — | 1,200 | 1,600 | 3,200 |
Source: company filings [14] [15] [16] [17]. Click any linked figure to open the filing page with the row highlighted.
Long-Term Record
| Fiscal year | Total revenue | Income from operations | Net income | Diluted earnings per share | Operating cash flow |
|---|---|---|---|---|---|
| FY2016 | 263,317 | (1,350) | 14,814 | 0.44 | (12,807) |
| FY2017 | 333,764 | 1,165 | 4,657 | 0.13 | 12,691 |
| FY2018 | 444,938 | (852) | 6,601 | 0.18 | 28,808 |
| FY2019 | 547,405 | 47,508 | 48,458 | 1.34 | 26,652 |
| FY2020 | 560,412 | (38,942) | (15,702) | (0.44) | (33,242) |
| FY2021 | 747,590 | (7,501) | 5,284 | 0.14 | 9,502 |
| FY2022 | 847,133 | 6,082 | (2,002) | (0.05) | (55,661) |
| FY2023 | 1,058,522 | 73,551 | 90,954 | 2.32 | 97,333 |
| FY2024 | 1,194,615 | 9,279 | 14,012 | 0.36 | 168,481 |
| FY2025 | 1,403,665 | 189,249 | 177,687 | 4.52 | 238,663 |
Source: consolidated statements across filings; older years from the standardized feed [8] [1] [9] [2]. Click any linked figure to open the filing page with the row highlighted.
Analyst Consensus
Mean target
Median target
High target
Low target
Street ratings: 2 strong buy, 1 buy, 13 hold. Consensus: Hold.
Estimate source: S&P Capital IQ (CapIQ) consensus, as of 2026-08-03. Estimate figures are S&P Capital IQ consensus (vendor data — no filing page links). EPS and net income use the normalized (adjusted) consensus where the street reports it. Line-item analyst models (segments, drivers, KPIs) are in the Visible Alpha tab.
Traceability
350 of 365 figures on this page (96%) link to the filing page where they are printed — click a linked figure to open the source PDF at that page with the row highlighted. Unlinked figures come from standardized data feeds or pre-filing years.
All figures in thousands of US dollars, as printed in Penumbra's SEC filings ('in thousands, except share and per share amounts').
Citation filings: FY2025/FY2024/FY2023 columns cite the FY2025 Form 10-K (3-year statements); FY2022/FY2021 income, cash-flow and revenue cite the FY2023 Form 10-K; FY2021 balance sheet cites the FY2021 Form 10-K (the FY2023 10-K balance sheet prints only FY2023/FY2022).
Revenue disaggregation uses the company's Thrombectomy / Embolization and Access product cut (available for all of FY2021-FY2025); a Revenue by Geography table (United States / International) is shown alongside. The older Vascular / Neuro cut was retired and is not shown.
FY2016-FY2018 long-term figures are from the standardized data feed (SEC XBRL) and are shown without page links; FY2016-FY2018 total revenue is feed cost-of-revenue plus feed gross profit. FY2019-FY2020 long-term figures are cited to the FY2021 Form 10-K.
Diluted EPS and per-share figures are on net income attributable to Penumbra, Inc.; no stock split occurred over the period, so quarterly EPS is stated on the current share basis (eps_split_adjusted=false).
The FY2024 Impairment charge ($76,945K, a Sixense/immersive-healthcare VR write-down) and negative FY2024 financing (a $100,387K share repurchase) are the two one-time items that depressed FY2024 GAAP operating income and cash flow; Penumbra otherwise carries no debt and had never repurchased stock before FY2024.
Q4 FY2025 quarterly income and balance-sheet figures are taken from the FY2025 earnings press release (Exhibit 99.1) and the FY2025 10-K; the press release prints no cash-flow statement, so Q4 single-quarter cash flows are derived from the FY2025 10-K full-year statement minus the Q3 nine-month year-to-date 10-Q (all derived values reconcile exactly and cross-check the quarterly data feed).
2 figure(s) differed between the data feed and the filing; the filing value is shown (see the run's metrics/metrics_tab.json for the audit trail).
Penumbra, Inc.'s management explains the business in its own materials. The slides below do the most of that work, pulled from the documents preserved in Sources. Each source link opens the complete presentation at that slide in a new tab.
Boston Scientific to Acquire Penumbra — Announcement Deck — 2026
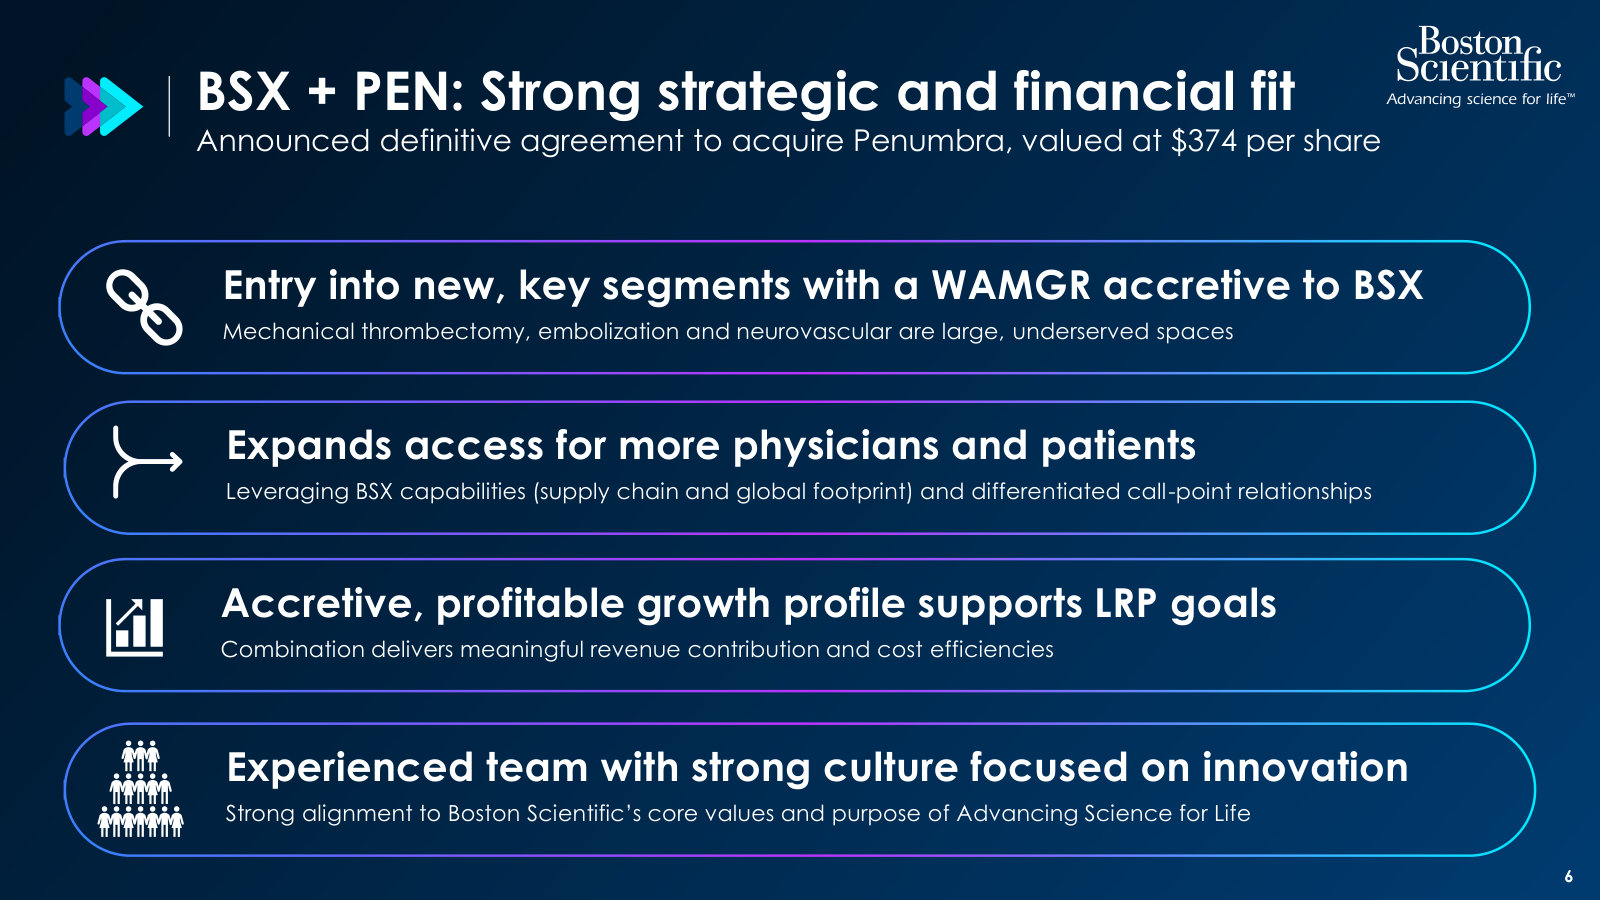
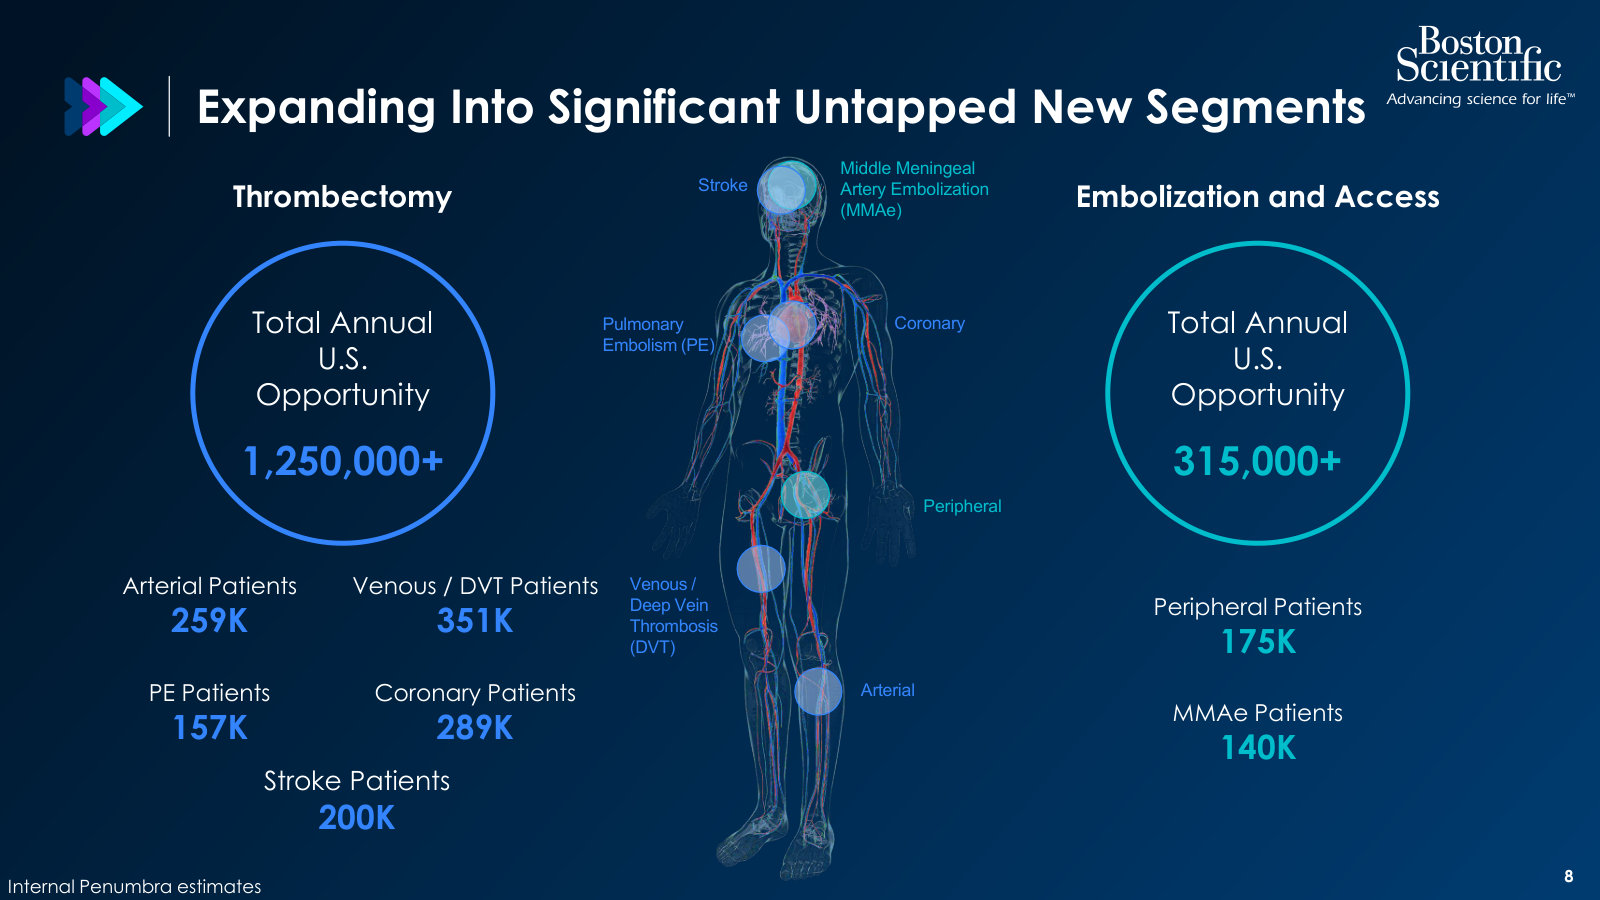
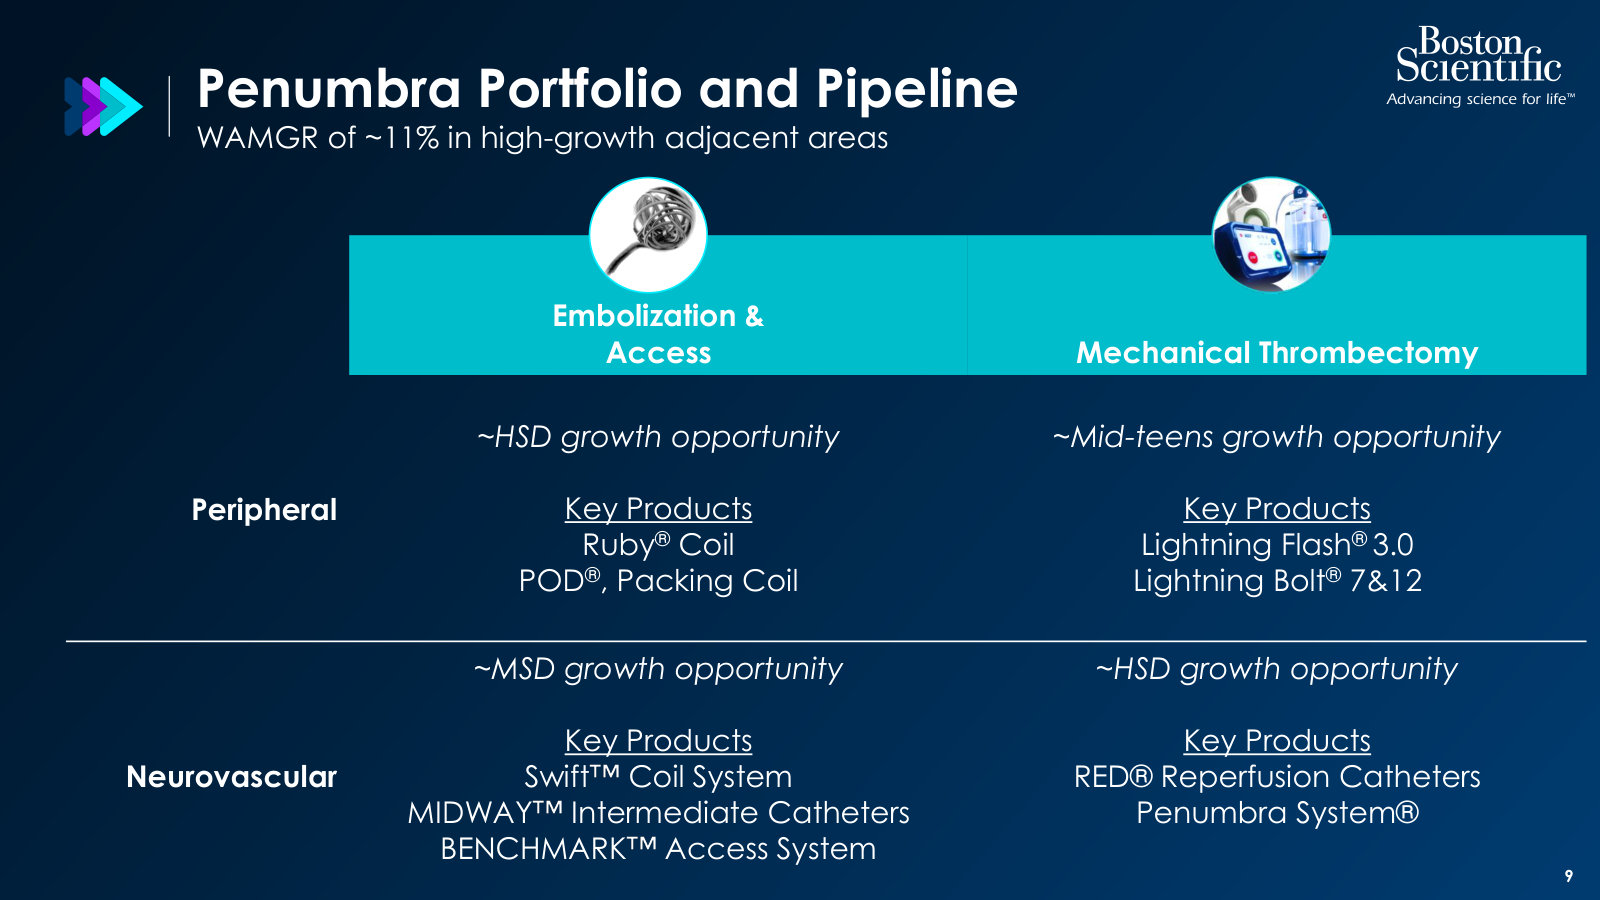
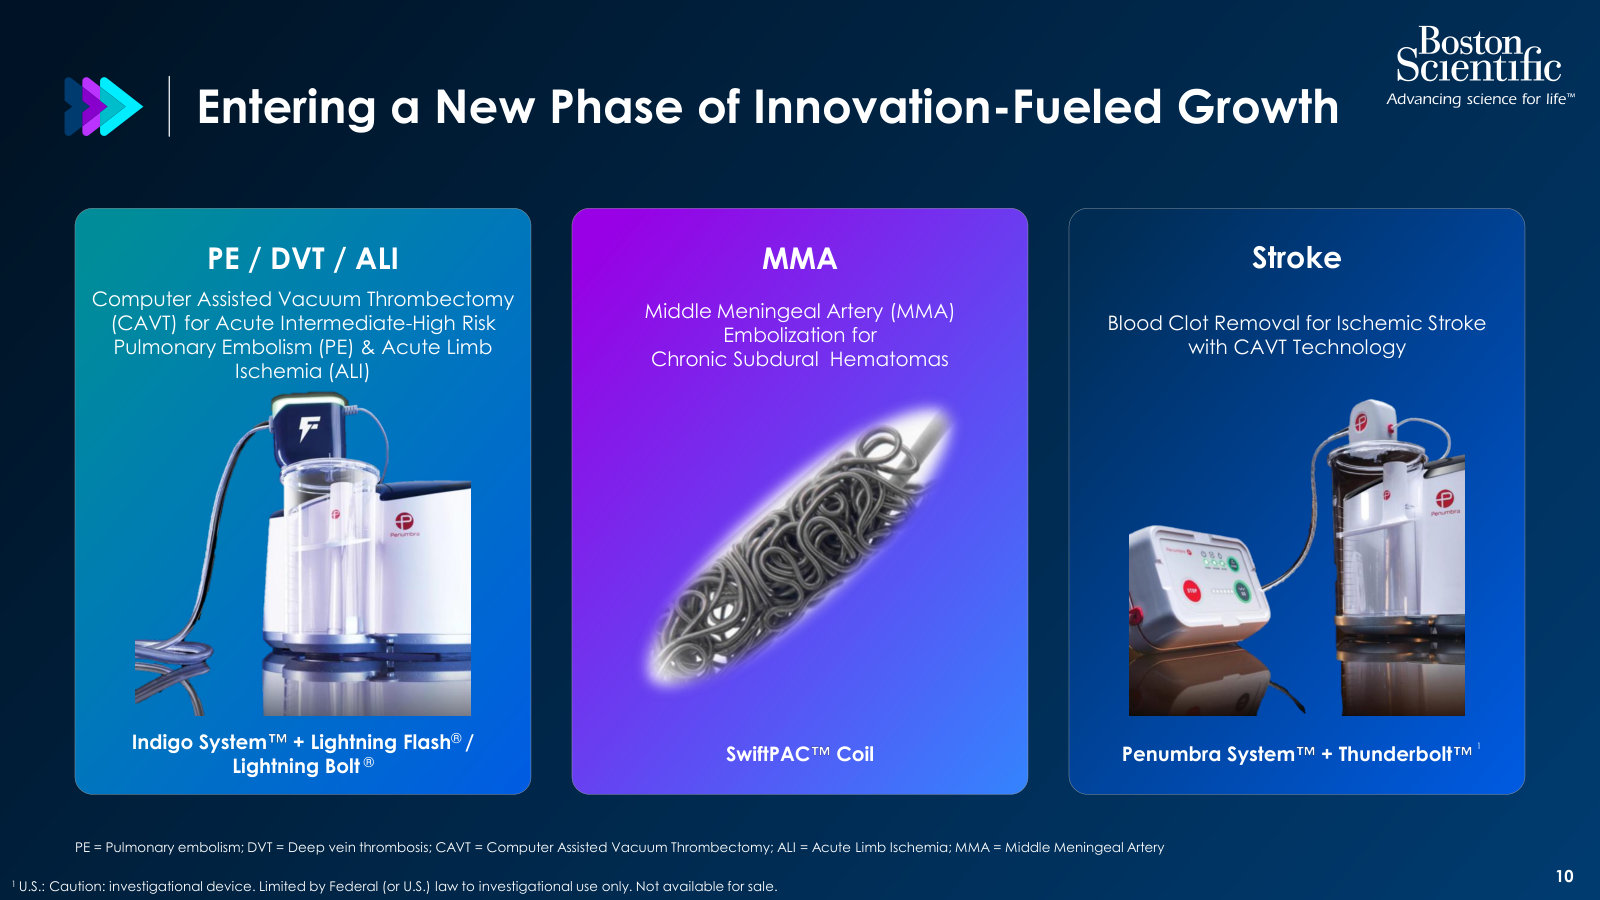
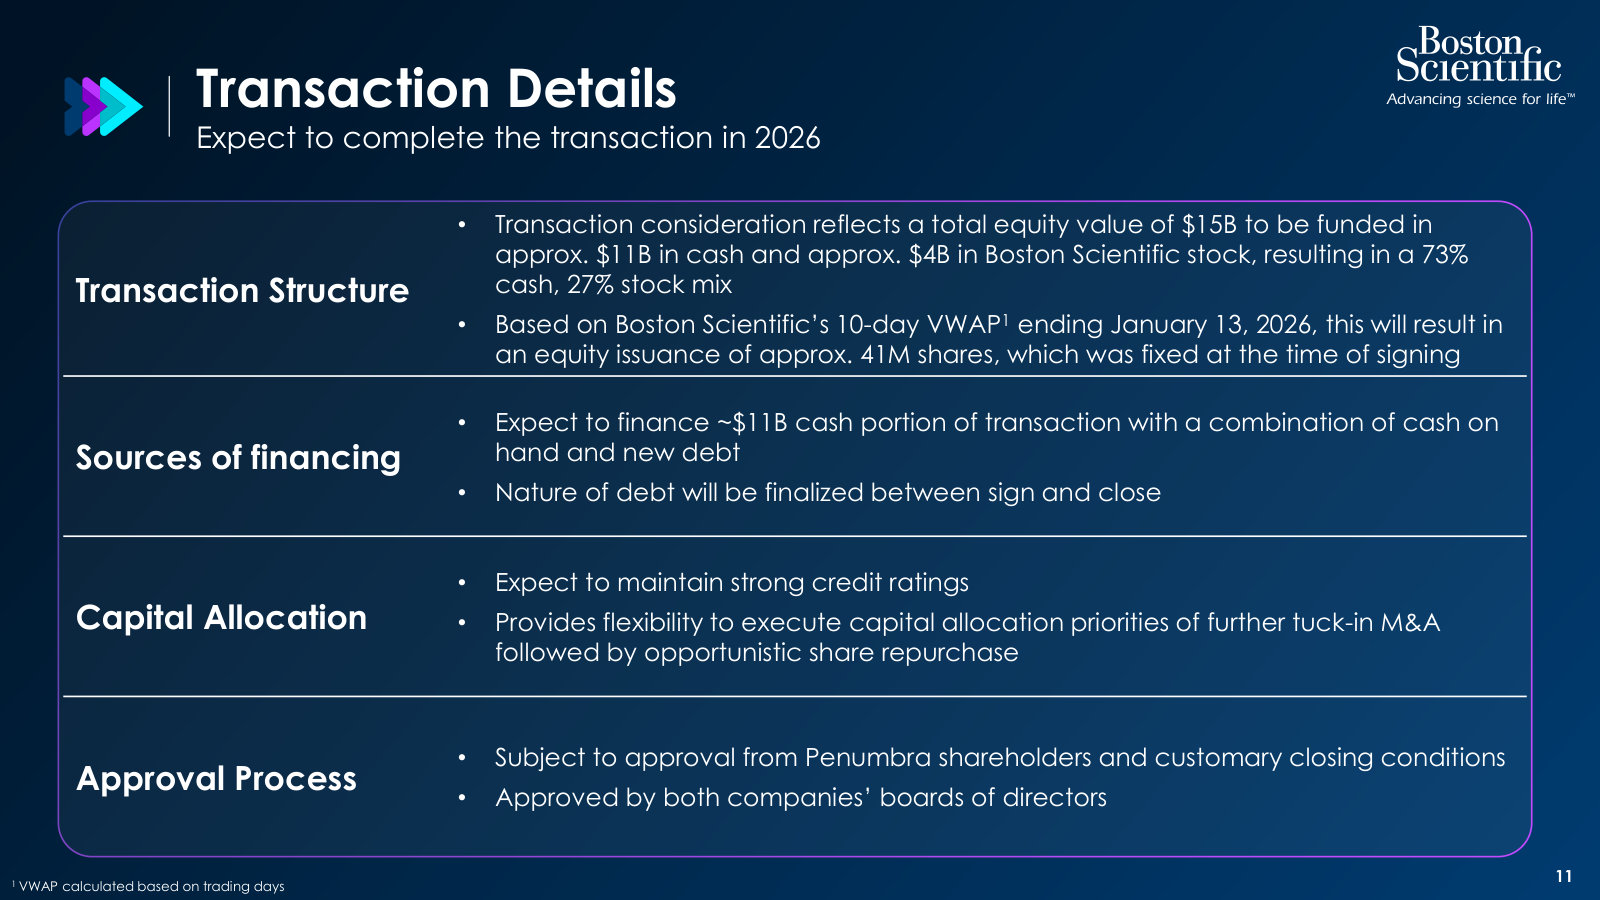
Boston Scientific's deck announcing its ~$15B acquisition of Penumbra — a crisp current snapshot of the business, its markets and the deal. · Open the full document →
J.P. Morgan Healthcare Conference — Company Overview — 2024
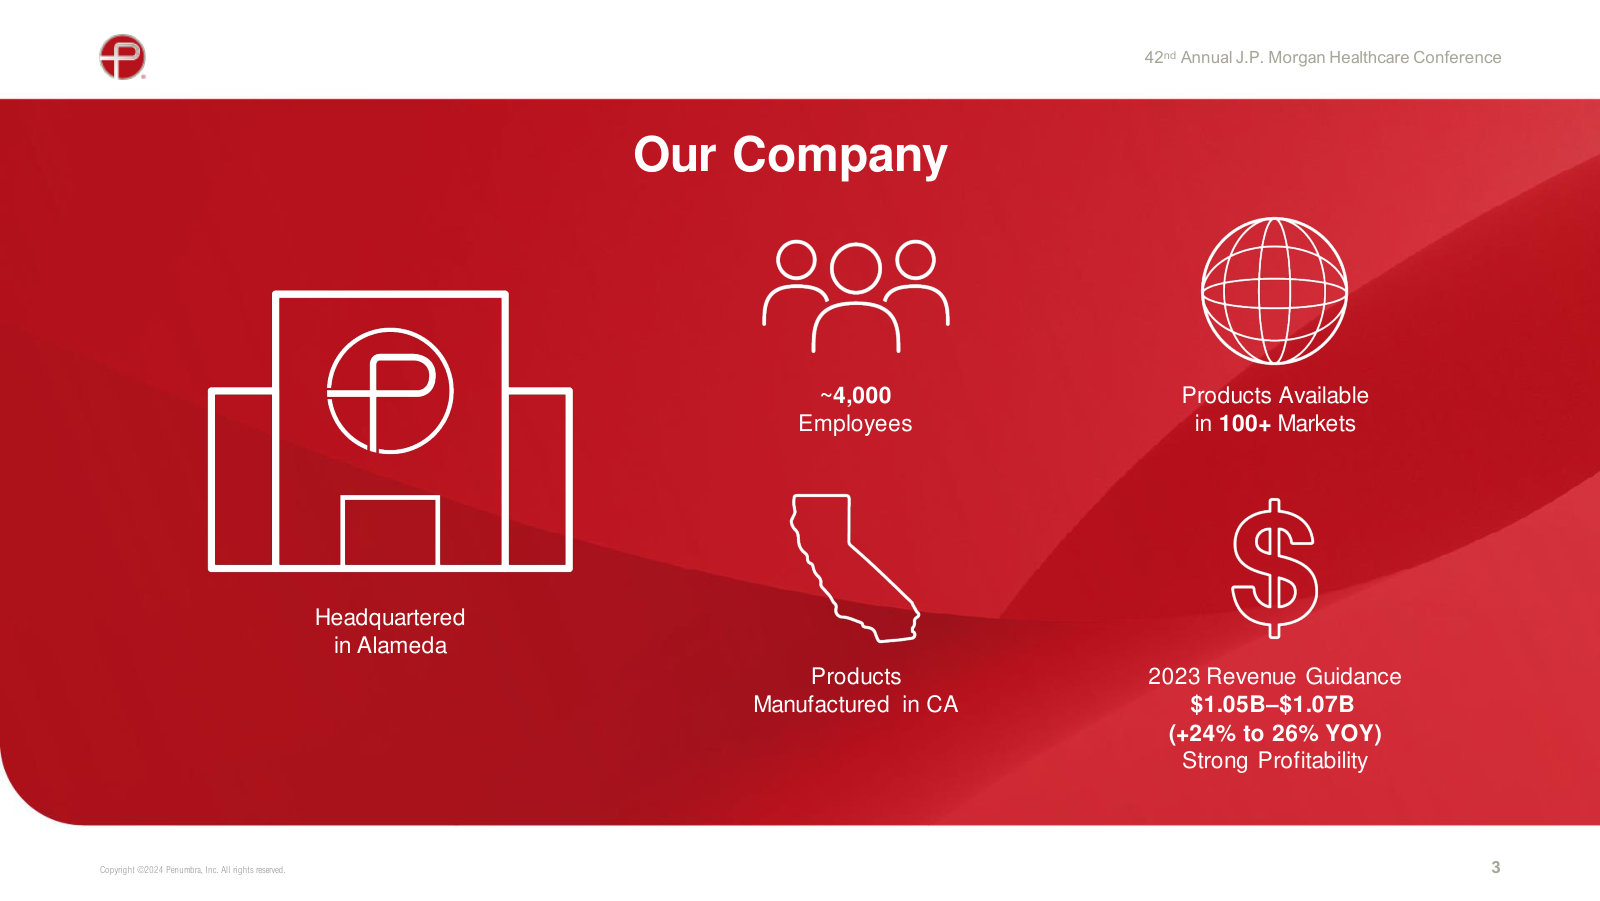
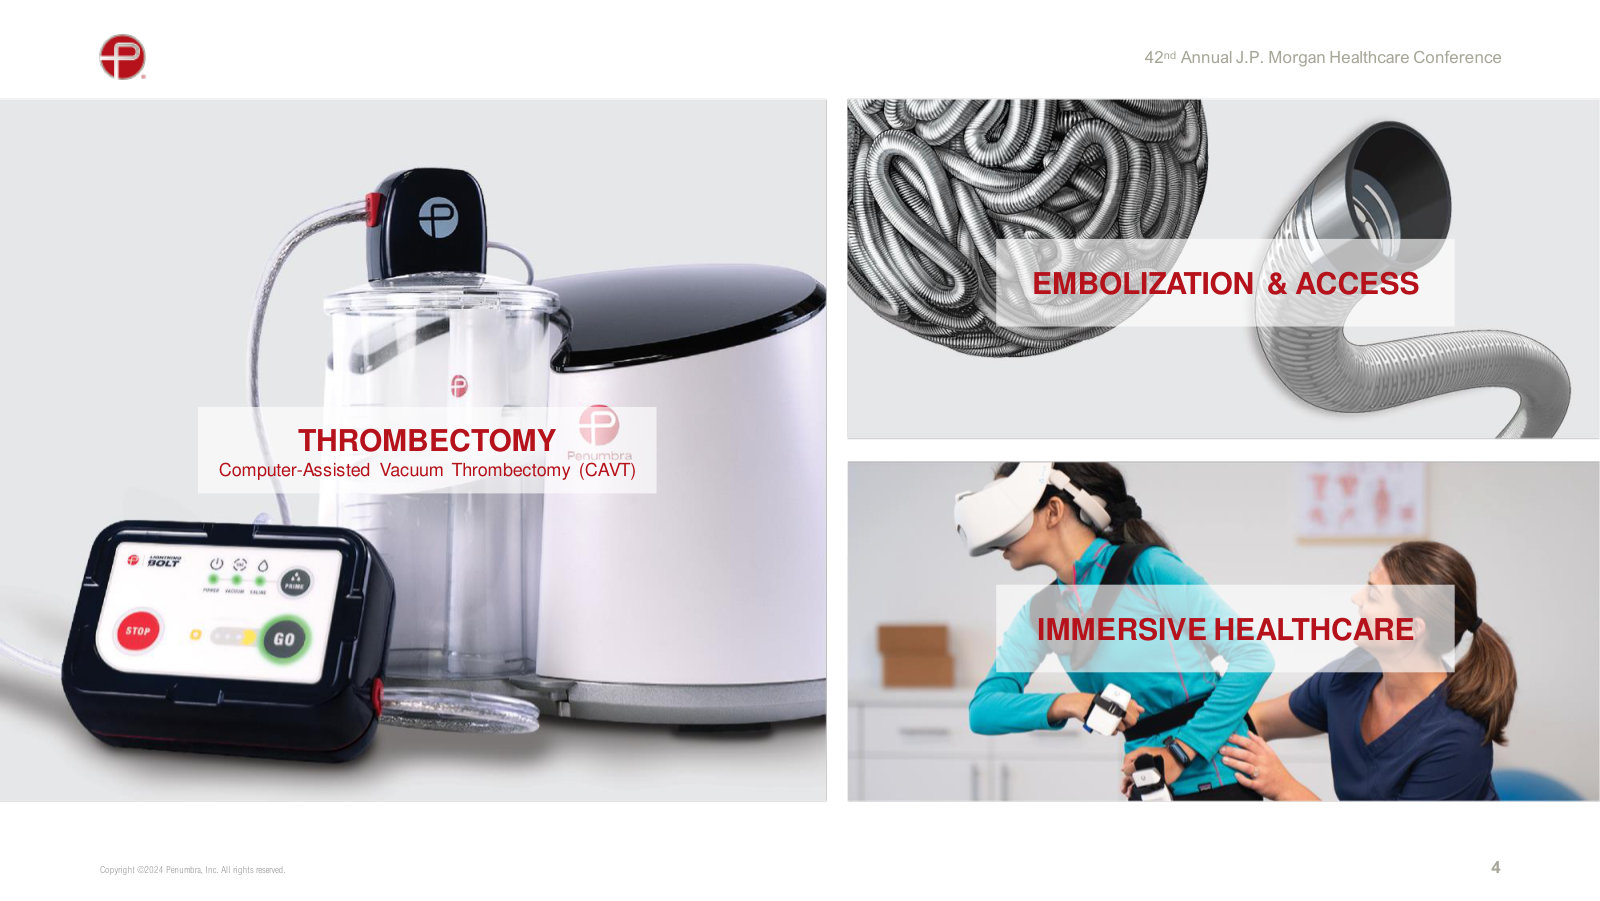
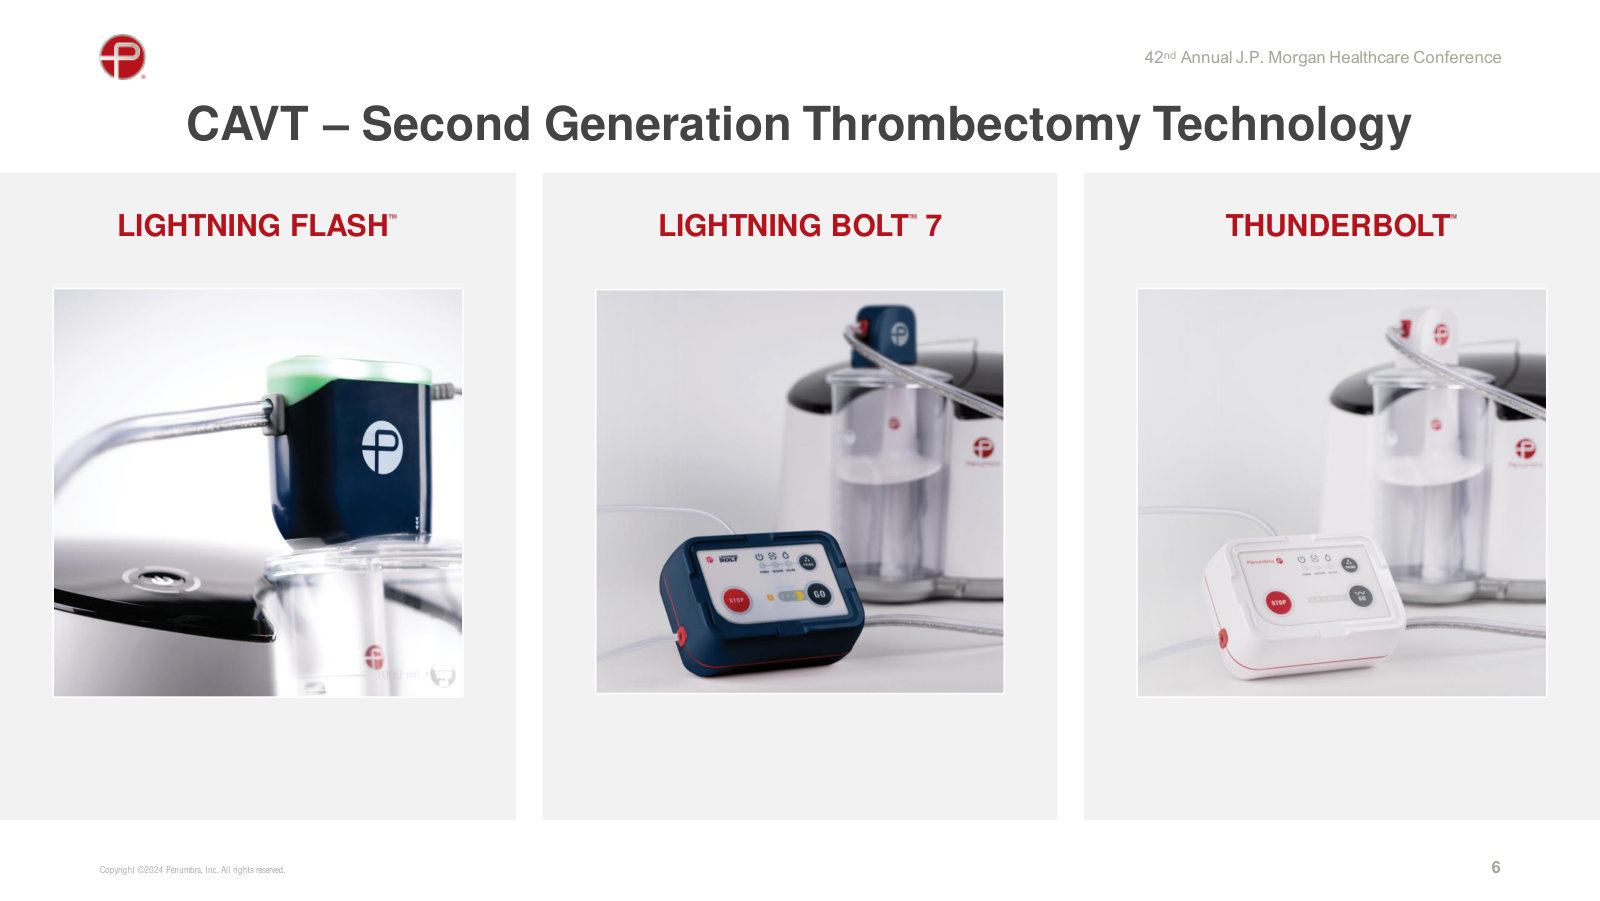
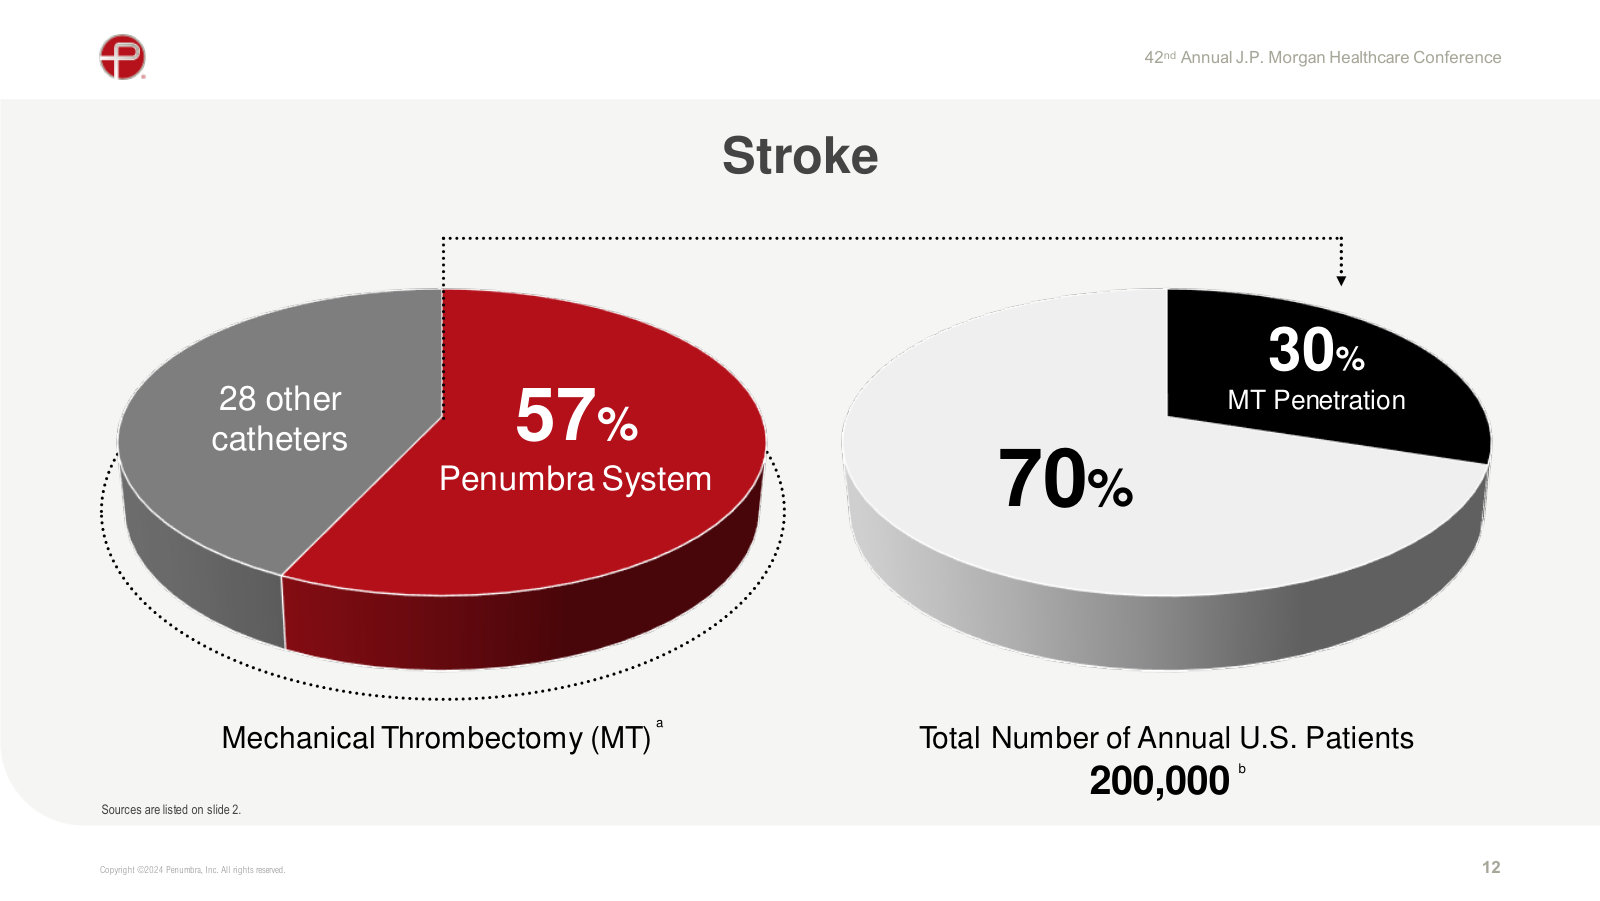
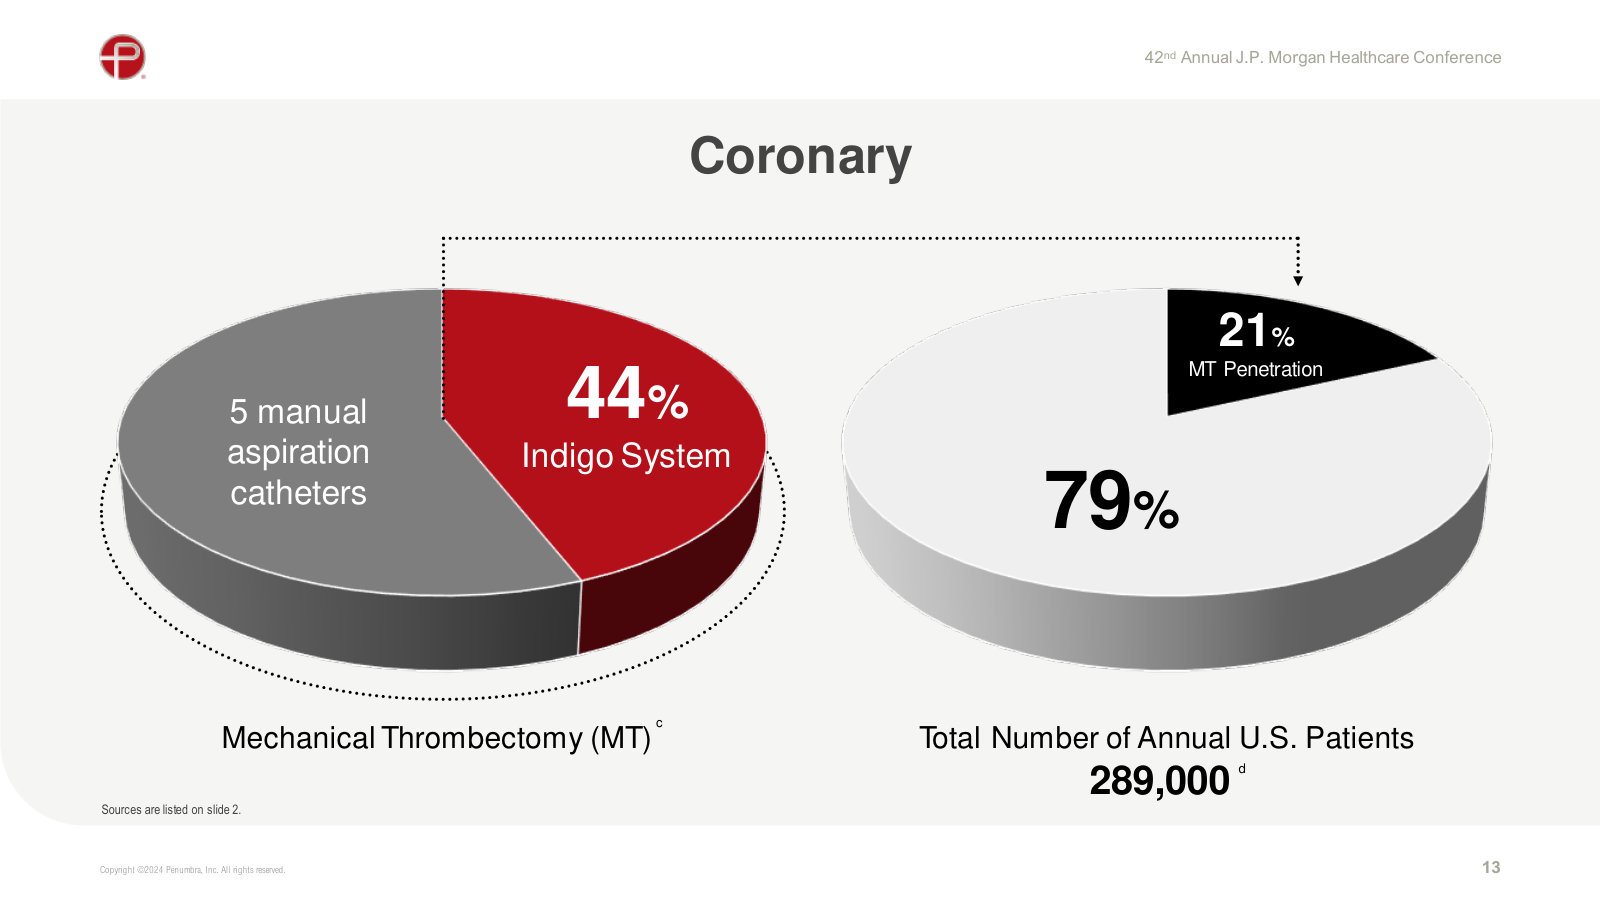
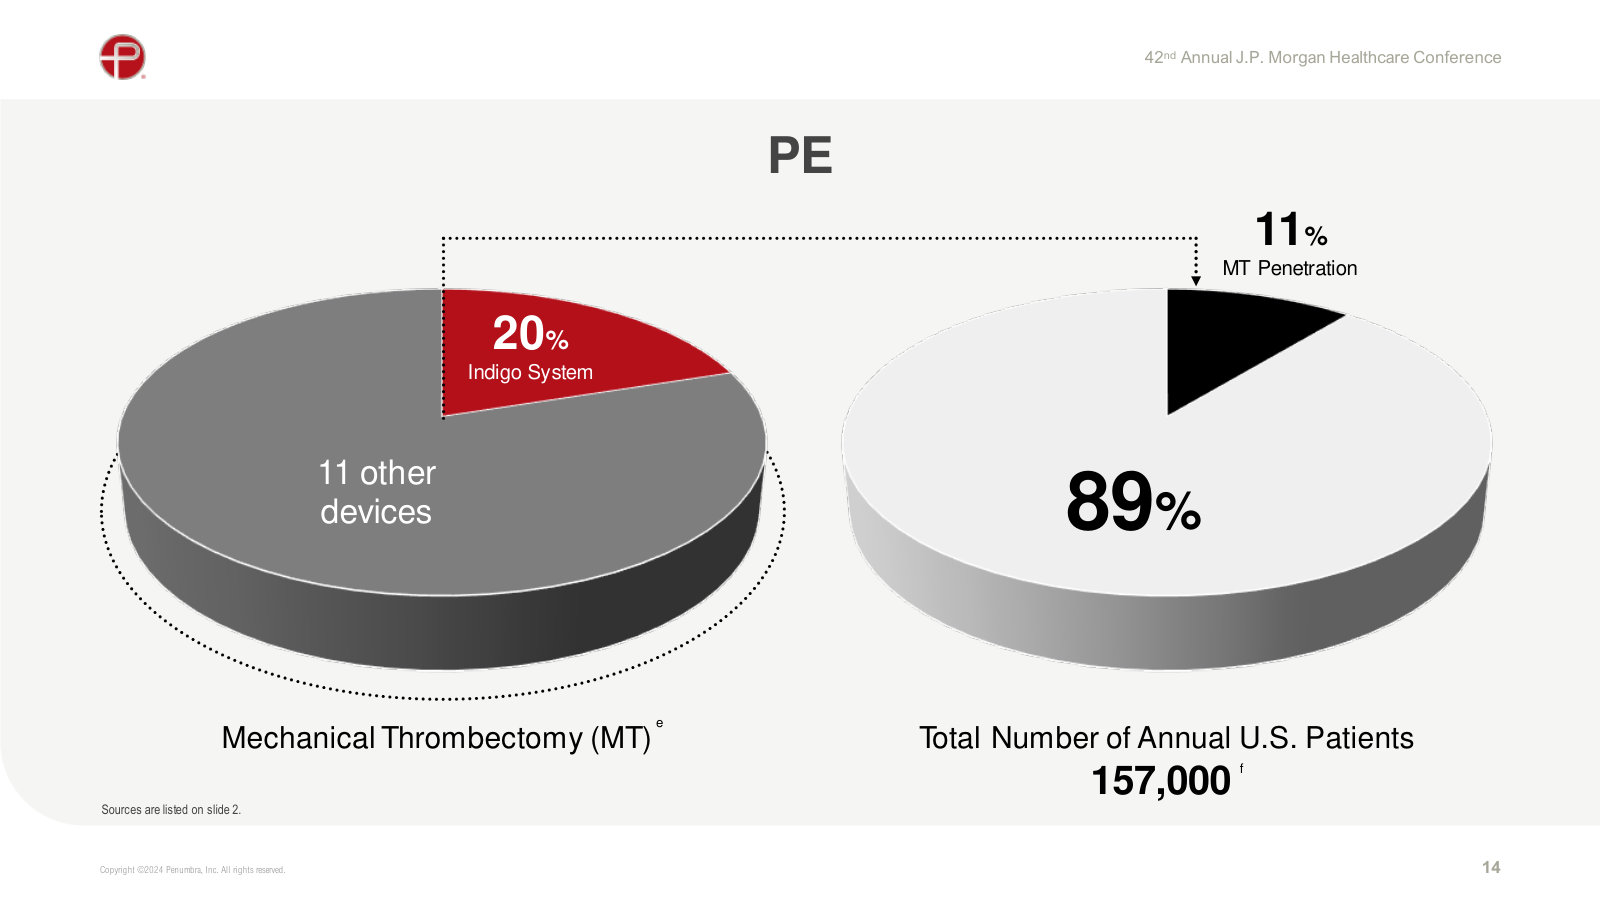
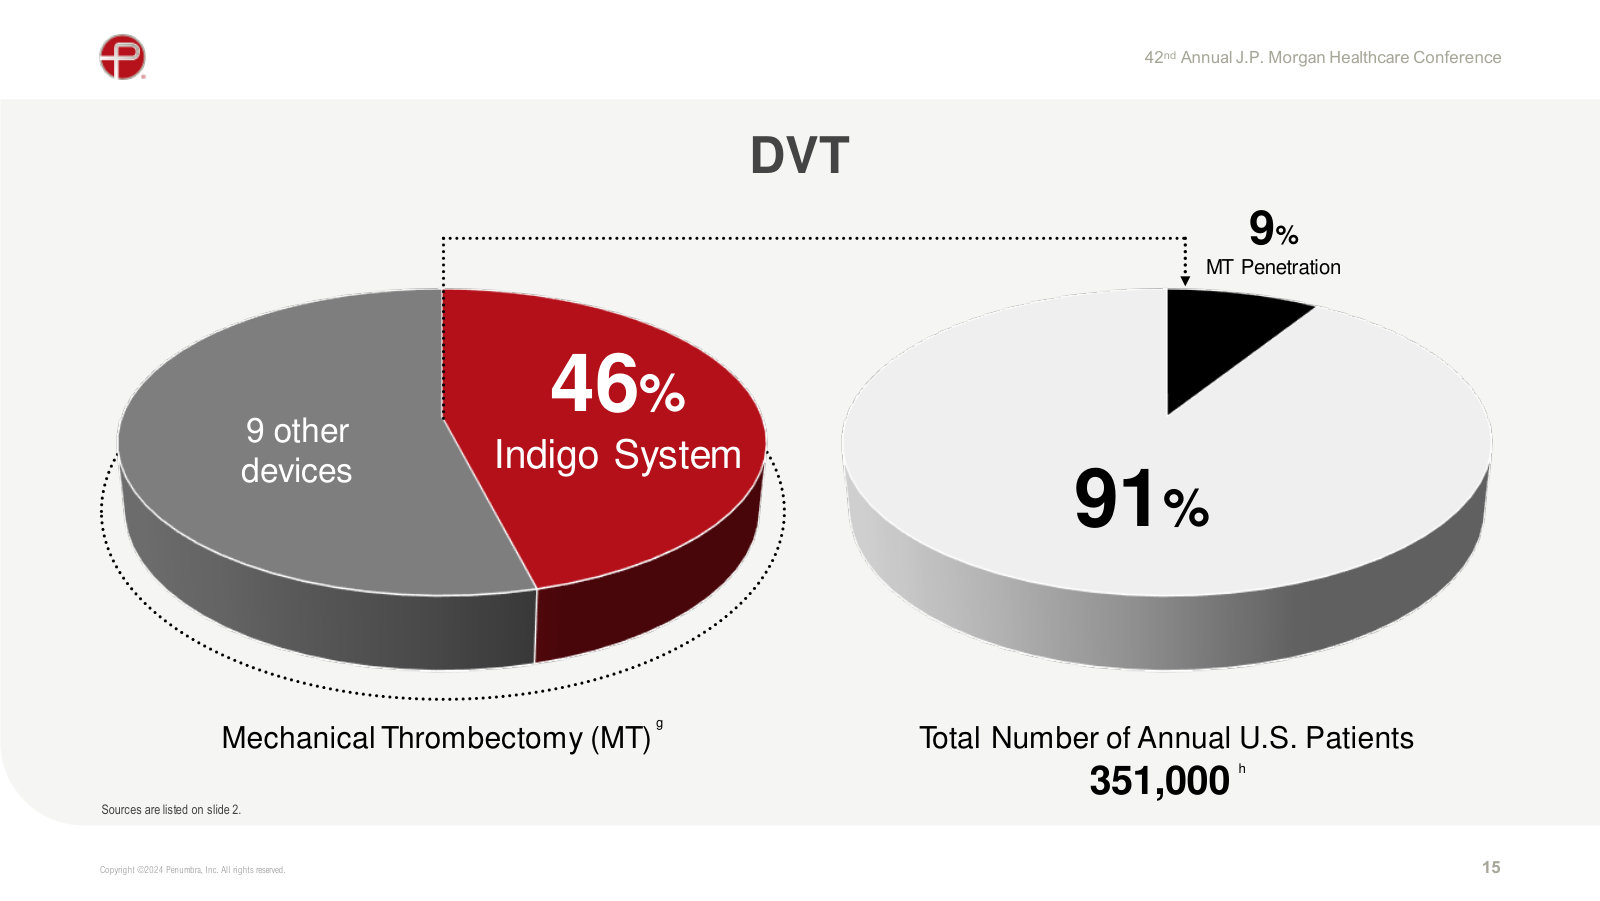
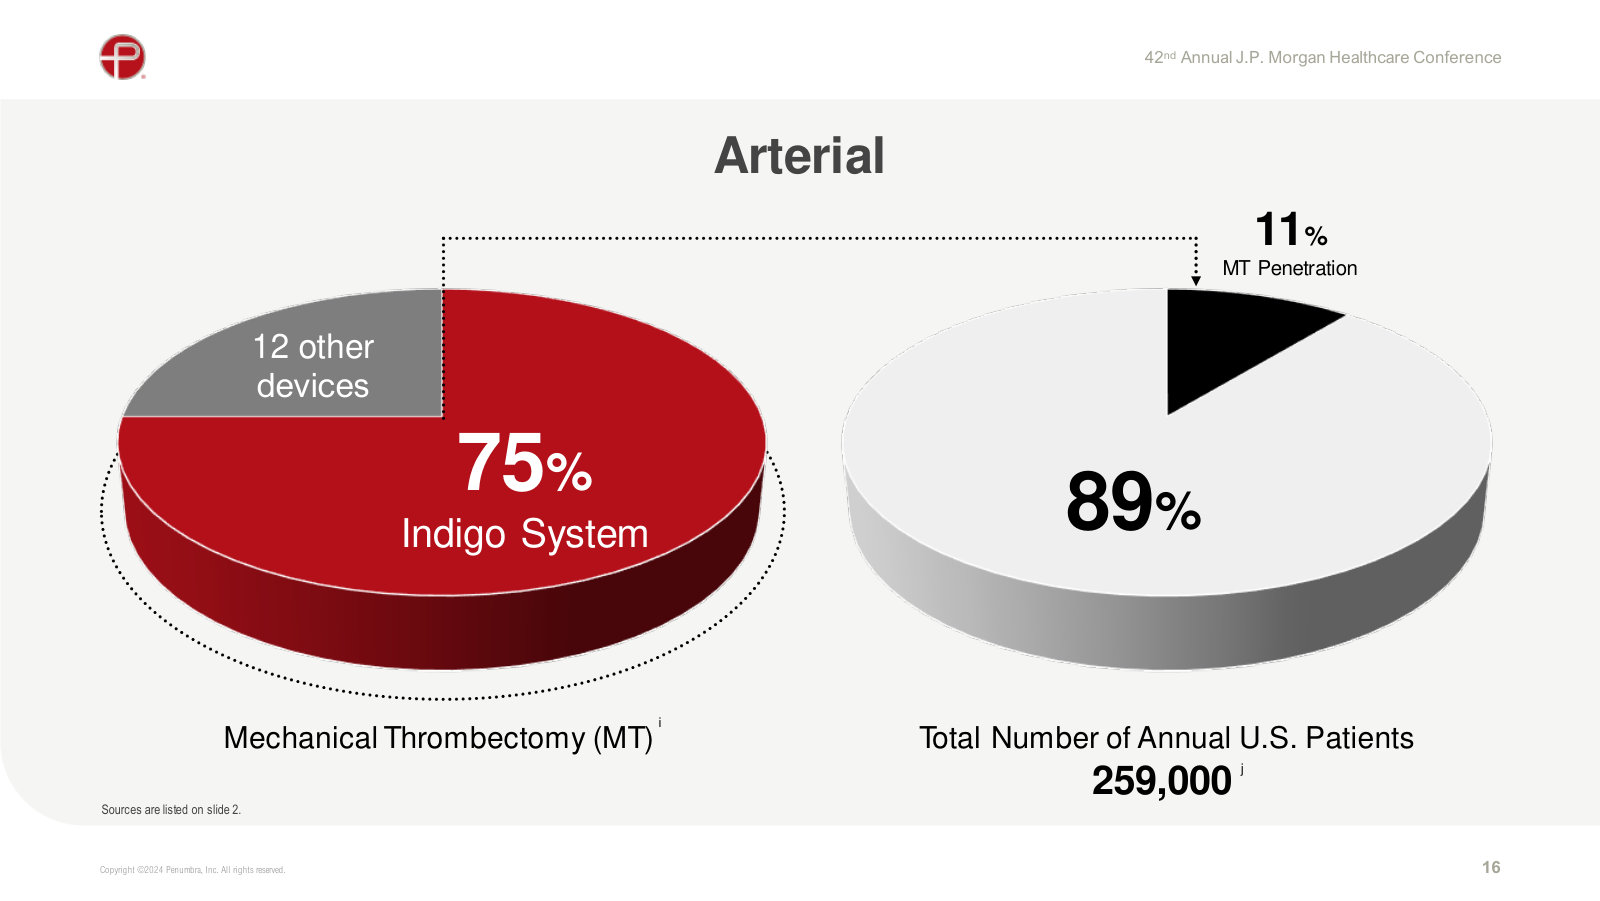
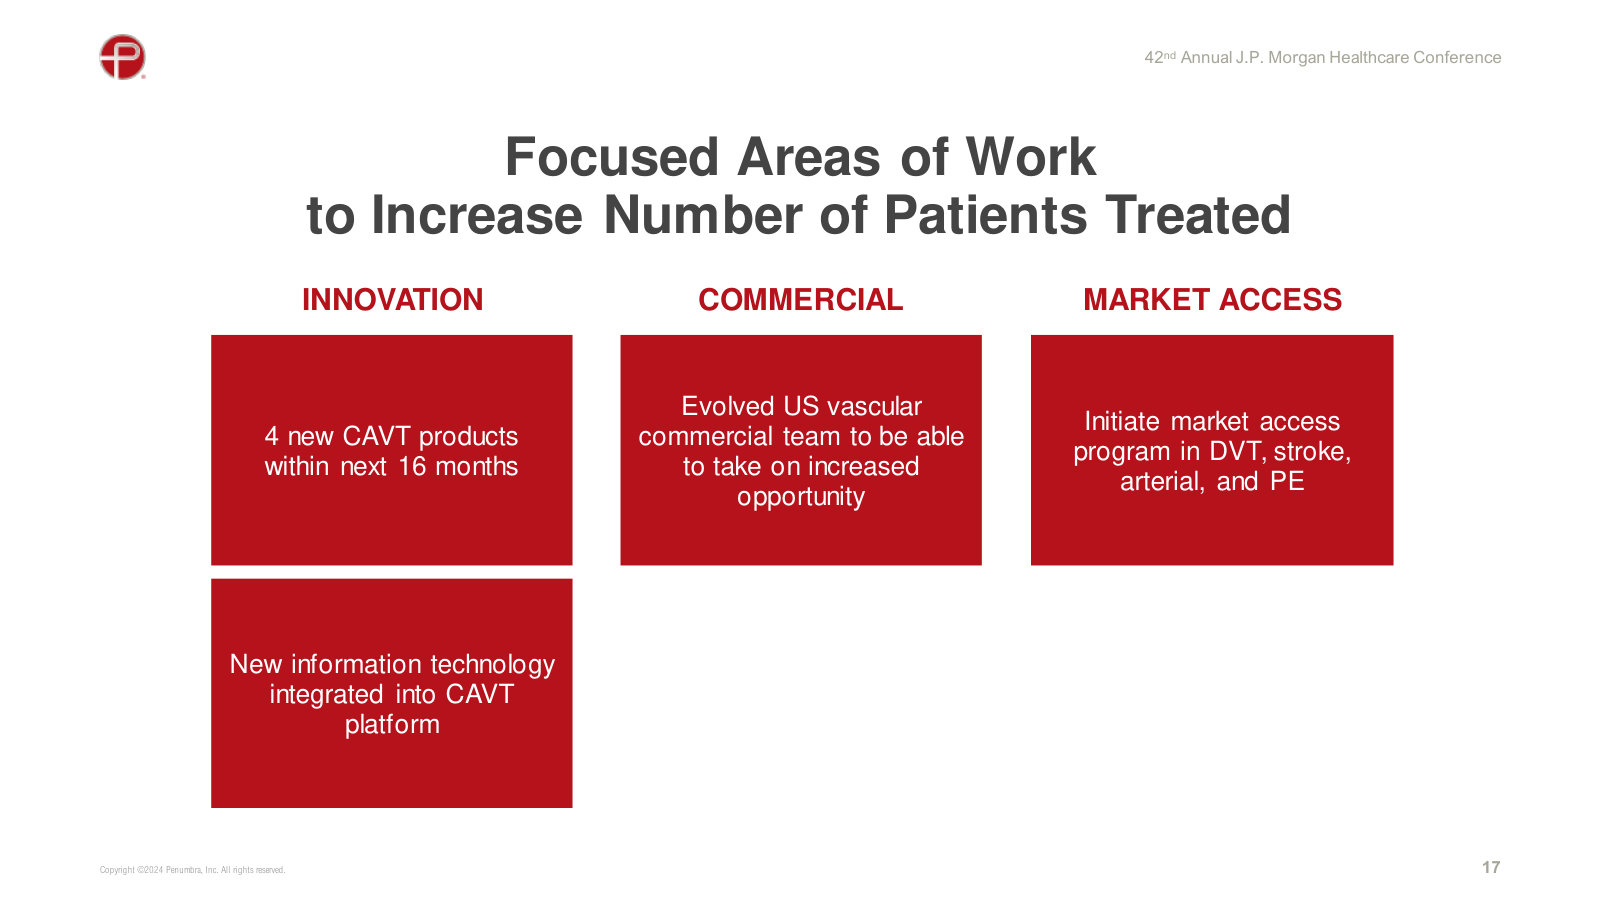
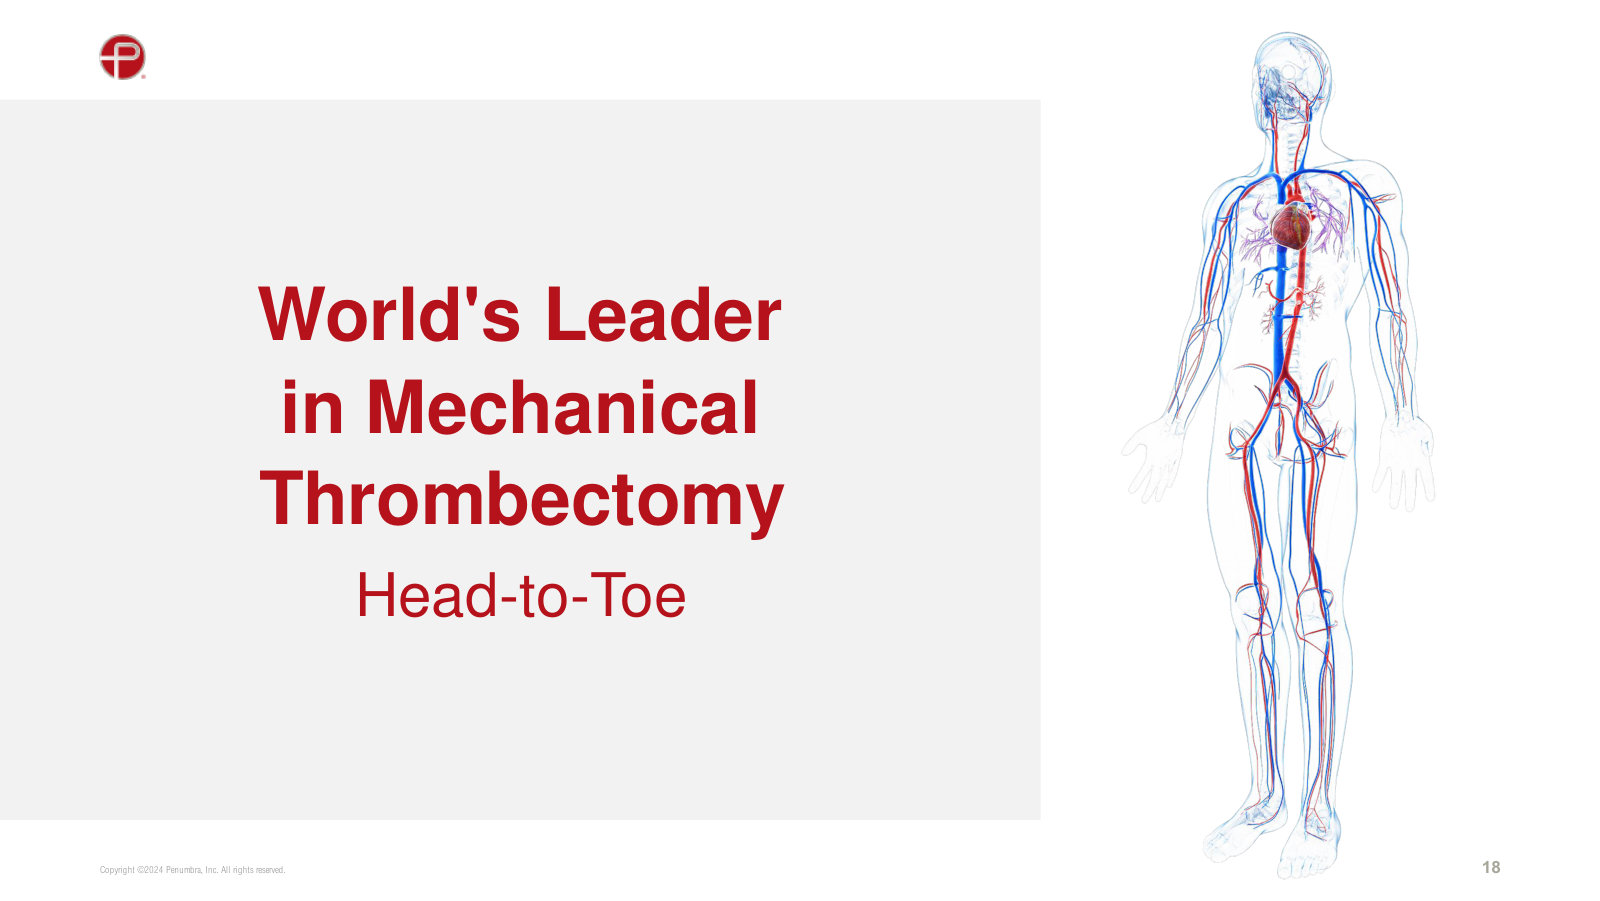
Penumbra's own J.P. Morgan deck — management walking through the business, the CAVT product line, and market share by vascular indication. · Open the full document →
Penumbra, Inc.'s management answers for the business every quarter. These are the exchanges that explain it best — verbatim, from the call transcripts preserved in Sources. Each link opens the full transcript at that page in a new tab.
Q3 2025 Earnings Call — Q3 2025
The most recent call, and a landmark: the positive STORM-PE randomized trial, the Thunderbolt FDA update, and how the franchises now split. · Open the full transcript →
The quarter by franchise — total, U.S., thrombectomy, VTE and embolization/access growth in one pass.
Adam Elsesser (Chairman and CEO): In the third quarter, we generated total revenue of $354.7 million, representing underlying year-over-year growth of 17.8% on a reported basis and 16.9% on a constant currency basis. […] Total U.S. revenue was $275 million in the third quarter, an increase of 21.5% compared to the third quarter of 2024. Total U.S. thrombectomy sales increased 18.5% year-over-year to $192 million. Our VTE franchise once again led overall corporate growth, delivering 34% year-over-year growth. U.S. embolization across access revenue of $83 million increased 29.2% year-over-year.
p. 1 · Read in context →
STORM-PE, the landmark RCT: CAVT beat standard of care on primary and secondary endpoints, and is already shifting practice.
Shruthi Narayan (President): STORM-PE proved CAVT superior to the current standard of care across the primary as well as multiple secondary endpoints showing CAVT patients recovered earlier and have significant long-term improvement in functional outcomes. […] Since the presentations, we are seeing a shift to CAVT from older mechanical thrombectomy options for PE.
p. 2 · Read in context →
The SG&A step-up is the embolization sales-force build-out — now complete, setting up operating leverage.
Maggie Yuen (Chief Financial Officer): SG&A expenses for Q3 2025 were $168.9 million or 47.6% of revenue compared to $137.4 million or 45.6% of revenue for Q3 2024. […] Sequentially, our SG&A expenses increased by $8.9 million, reflecting the full quarter presence of our embolization sales team investment along with other variable spend. With this build-out now complete, we are positioned to capture sales and operating leverage in future quarters.
p. 4 · Read in context →
Why Thunderbolt's FDA path runs long — it's a brand-new device, not a new indication on an already-approved one.
Adam Elsesser (Chairman and CEO); Travis Steed (Bank of America): Thunderbolt is a brand-new product. It doesn't – it's not already approved. It doesn't – it's not just seeking a new indication. […] For products that are brand new, those processes, at least in our experience with the neuro division sometimes take a while.
p. 5 · Read in context →
Q4 and Full Year 2024 Earnings Call — Q4 FY2024
The full-year strategy call: the 'analog to digital' framing for CAVT, the size of the untapped market, why growth is volume not price, and the guidance philosophy. · Open the full transcript →
Growth is volume, not price: 'It's almost all volume … There's not a pricing element now.'
Pito Chickering (Deutsche Bank); Adam Elsesser (Chairman and CEO): Is there any color on what the pricing versus volume was in the quarter? […] Yes. At this stage, we're several years into this. It's almost all volume. It's volume. There's not a pricing element now. This was just that, and that's why I went out of my way to say we ended the year with the strongest case volume we've ever seen, both in VTE and in arterial.
p. 7 · Read in context →
Q2 2024 Earnings Call — Q2 FY2024
The call where the thesis was tested: management met new VTE competition, announced the exit from Immersive Healthcare, cut full-year guidance by $60M, and reset its guidance philosophy. · Open the full transcript →
The strategic pivot: exiting Immersive Healthcare (VR) to put 100% of resources behind the interventional/CAVT business.
Adam Elsesser (Chairman and CEO): Even with this confidence in the long-term benefit and likely success of our Immersive Healthcare platform and technology, our current focus needs to be on helping as many patients as possible in our interventional business, particularly in this critical moment where we believe our CAVT technology can help most patients who need thrombectomy. Therefore, we have begun to explore alternative avenues for the Immersive Healthcare business. […] This strategic move allows us to focus 100% of our time, energy, and resources to help as many patients as possible while increasing our company's profitability.
p. 3 · Read in context →
Where the guidance philosophy was born: guidance will now 'reflect a comfortable level of conservatism.'
Adam Elsesser (Chairman and CEO): That being said, we have traditionally set revenue guidance in line with our best assessment of what we can achieve. Going forward, our guidance will reflect a comfortable level of conservatism.
p. 3 · Read in context →
The guide-down, itemized: a $60M cut split across China, Europe, Immersive and U.S. thrombectomy.
Jason Mills (Executive Vice President of Strategy): Our updated guidance range for 2024 includes total revenue of $1,180 million to $1,200 million, which is a reduction of $60 million at the midpoint from our previous guidance range. The $60 million change in guidance comes from four distinct components impacting our revenue in the second half of the year; $20 million reduction to our business in China due to much more challenging economic backdrop for medical devices in the near term, $15 million from our European business primarily as a result of a slight delay to our expected launch timing of Flash and Bolt 7 CAVT products in Europe, $5 million in revenue from our Immersive Healthcare business due to our strategic move, and approximately $20 million change to our guidance for U.S. thrombectomy growth for full-year 2024, which is now expected to be 23% to 25% year-over-year compared to 2023.
p. 4 · Read in context →
Q4 and Full Year 2020 Earnings Call — Q4 FY2020
A landmark from the archive: the December JET 7 XTRA FLEX recall that tested the stroke franchise, and the first public articulation of the 'get all the clot out' vision that later became CAVT and Thunderbolt. · Open the full transcript →
The quarter and the shock: a record $166.9M, minus $5.8M pulled by the mid-December JET 7 XTRA FLEX recall.
Adam Elsesser (Chairman and CEO): Our total revenues for the fourth quarter were $166.9 million, a year-over-year increase of 14.9% as reported and 13.7% in constant currency, which marks the second consecutive record quarter for Penumbra. […] This also included a reduction of $5.8 million in revenue due to the recall of JET seven XTRA FLEX in mid-December. Excluding this onetime impact, total Q4 non-GAAP revenue grew 18.9% to $172.7 million.
p. 4 · Read in context →
How the recall played out clinically: some physicians trialed rivals, then returned to Penumbra's ACE68 / JET 7 standard tip.
Adam Elsesser (Chairman and CEO): On the stroke side of the business, following the recall of JET seven XTRA FLEX, some of our stroke physicians switched directly to our ACE68 or JET seven standard tip, whereas others took this opportunity to try other reperfusion catheters. Following that trialing, some of those physicians are coming back to using either ACE68 or JET seven standard tip as their primary reperfusion catheter.
p. 6 · Read in context →
The recall's price tag: $5.8M of revenue, $12.6M in cost-of-sales charges, ~900 bps off gross margin.
Maggie Yuen (Chief Financial Officer): the financial impact in the fourth quarter was a reduction of $5.8 million in revenue due to refunds for product returns as well as $12.6 million in charges to cost of sales, primarily related to inventory write-offs and cost for product exchanges. This voluntary recall had an impact of approximately 900 basis points to our gross margin.
p. 9 · Read in context →
The seed of CAVT — years before Thunderbolt, the goal is stated: 'remove all the clot out as fast as possible in everybody.'
Adam Elsesser (Chairman and CEO); Ryan Zimmerman (BTIG): Right now, some physicians can – with certain patients, have great success quickly. Other patients don't have that kind of success. What we're trying to do is create a product that can have the ability to remove all the clot out as fast as possible in everybody. And so that's sort of the point.
p. 23 · Read in context →
More calls
Q2 2025 Earnings Call — Q2 2025 · 13 pages · Mid-2025 progress: the embolization sales-force build-out ramping and the Ruby XL launch, ahead of the STORM-PE read-out. · Open →
Q1 2025 Earnings Call — Q1 2025 · 14 pages · The first quarter under the two-team commercial structure, with early Thunderbolt and gross-margin-path commentary. · Open →
Q3 2024 Earnings Call — Q3 FY2024 · 11 pages · The crispest statement of the four-pronged CAVT strategy, plus the ~$40M/year savings from the completed Immersive wind-down. · Open →
Q4 and Full Year 2023 Earnings Call — Q4 FY2023 · 32 pages · The prior full-year call — the baseline year against which the 2024 CAVT ramp and Immersive exit are measured. · Open →
Q1 2024 Earnings Call — Q1 FY2024 · 11 pages · Early-2024 setup: first competitive launches in embolization and the CAVT rollout before the mid-year guidance reset. · Open →
Q3 2023 Earnings Call — Q3 2023 · 30 pages · An early CAVT-era quarter for readers tracing the technology's commercial launch trajectory. · Open →
Penumbra, Inc.'s annual reports contain management's most considered account of the business. These are the sections, passages and visual pages worth opening in the originals preserved in Sources.
Penumbra, Inc. — FY2025 Annual Report (Form 10-K) — FY2025
The reset year: Penumbra recast itself as “the world’s leading thrombectomy company,” finished exiting VR rehab, and agreed to a $14.5B Boston Scientific takeout. · Open the full document →
Item 1. Business — Overview — p. 8 · Read the full section →
Management’s own definition of the company — a pure-play, clot-removal medical-device maker across stroke, VTE and limb ischemia.
How Penumbra now describes itself: the world’s leading thrombectomy company.
Penumbra, the world’s leading thrombectomy company, is focused on developing the most innovative technologies for challenging medical conditions such as ischemic stroke, venous thromboembolism such as pulmonary embolism, and acute limb ischemia. Our broad portfolio, which includes computer assisted vacuum thrombectomy (CAVT), centers on removing blood clots from head-to-toe with speed, safety, and simplicity. […] We sell our products to healthcare providers primarily through our direct sales organization in the United States, most of Europe Canada, Australia and Singapore, as well as through distributors in select international markets.
p. 8 · Read in context →
Item 1A. Risk Factors — p. 38 · Read the full section →
The two company-specific risks that could actually bite: a pending merger that may not close, and inventory that can be written down overnight.
Deal risk: the $374/share Boston Scientific merger and its overhang on customers, employees and suppliers.
On January 14, 2026, we entered into the Merger Agreement with Boston Scientific Corporation and Merger Sub, pursuant to which Boston Scientific Corporation has agreed to acquire us for $374 per share pursuant to the Merger, with our stockholders having the right to elect, for each share of our common stock held by them, to receive $374 in cash or 3.8721 shares of Boston Scientific Corporation’s common stock (valued at $374 based on the volume weighted average price of Boston Scientific Corporation’s common stock over the 10 trading days ending January 13, 2026), subject to proration, so that the total transaction consideration is paid approximately 73% in cash and approximately 27% in shares of Boston Scientific Corporation’s common stock. […] Uncertainty about the effect of the Merger Agreement and the Merger on our customers, employees, suppliers, vendors, and business partners may have an adverse effect on our business and operations that may be material to our company.
p. 38 · Read in context →
Inventory risk — with the $33.4M immersive-healthcare write-down cited as a live example.
We maintain a significant inventory of raw materials, components and finished goods, which subjects us to a number of risks and challenges. Our hospital customers typically maintain only small quantities of our products at their facilities, so as products are used, they order replacements that typically require prompt delivery. As a result, we must maintain sufficient levels of finished goods to permit rapid shipment of products following receipt of a customer order. […] For example, during the three months ended June 30, 2024, we recorded a $33.4 million write-down of immersive healthcare inventory in connection with our strategic decision to explore alternative avenues for our immersive healthcare business.
p. 50 · Read in context →
Item 7. Management’s Discussion and Analysis — Overview — p. 102 · Read the full section →
Management frames the year in one breath: revenue scale, the immersive wind-down, and the January 2026 Boston Scientific deal.
Item 7. MD&A — Results of Operations — p. 111 · Read the full section →
Where the turnaround shows: gross margin 63.2%→67.1% and operating income $9.3M→$189.2M once the immersive drag is gone.
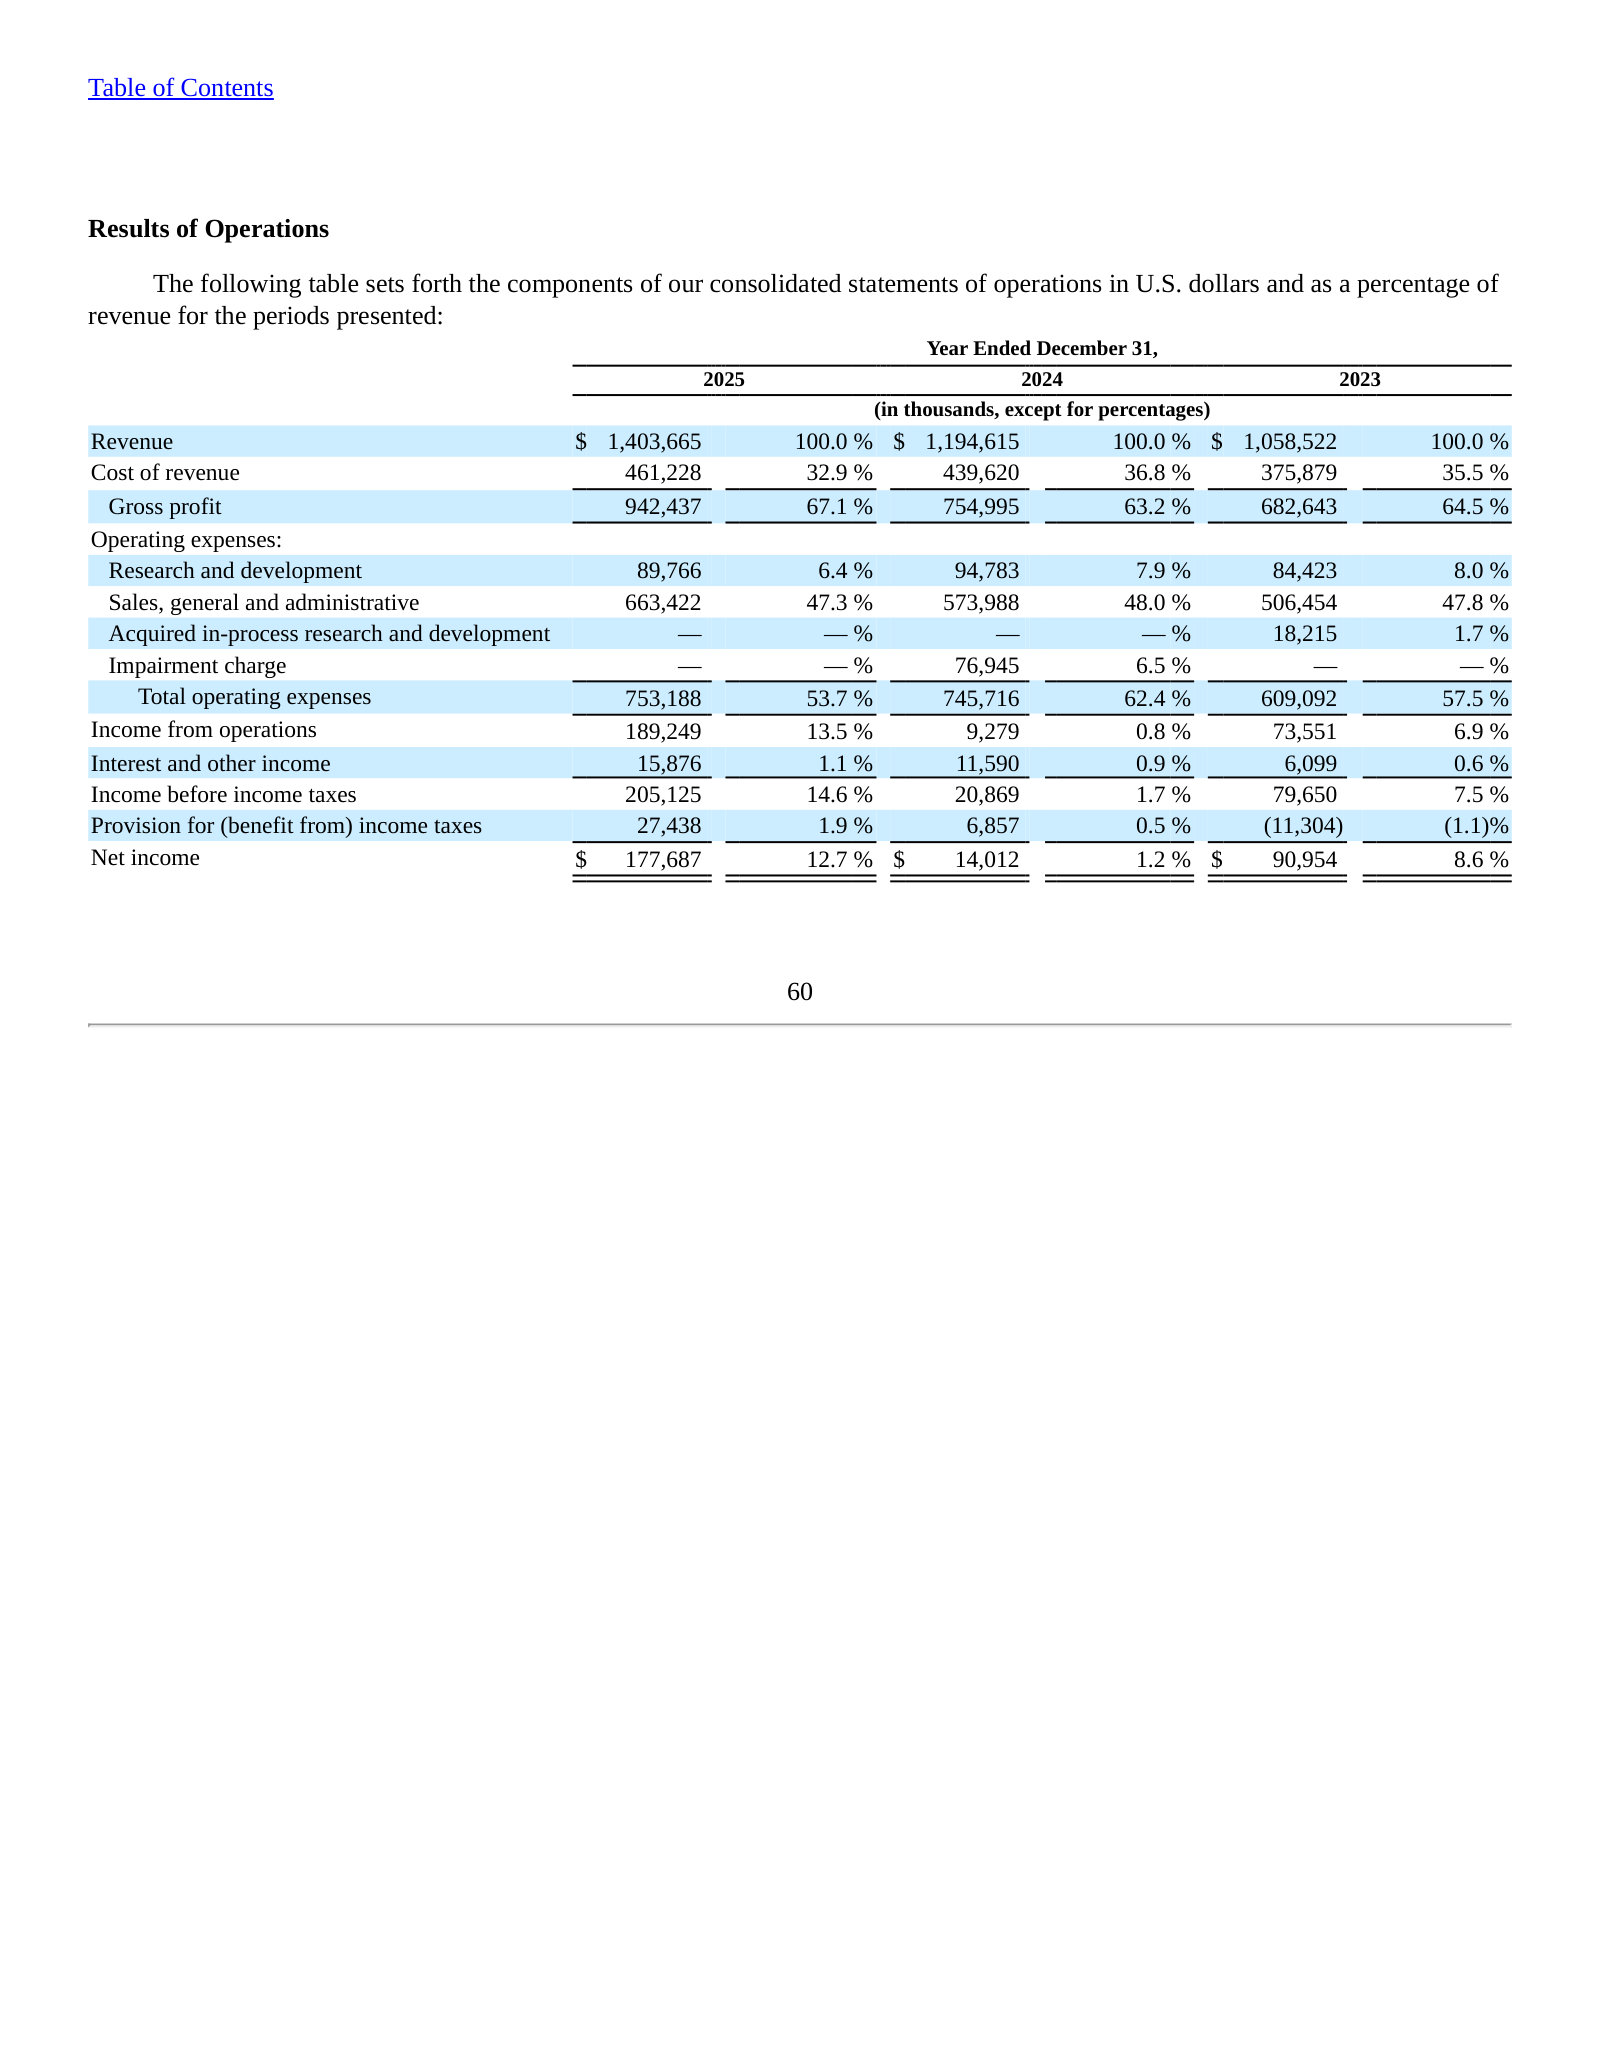
What drove the top line: U.S. thrombectomy volume +19.3%, with prices essentially flat.
Revenue increased $209.1 million, or 17.5%, to $1,403.7 million in 2025, from $1,194.6 million in 2024. Overall revenue growth was primarily due to an increase in sales of our new and existing thrombectomy and embolization and access products.
Revenue from our global thrombectomy products increased $132.4 million, or 16.2%, to $947.9 million in 2025, from $815.5 million in 2024. This increase in our global thrombectomy products was primarily attributable to higher sales volume in the United States as a result of sales of new products and further market penetration of our existing products. Sales of our U.S. thrombectomy products increased by 19.3% in the year ended December 31, 2025. Prices for our thrombectomy products remained substantially unchanged during the period.
p. 112 · Read in context →
Note 4. Exit of Immersive Healthcare Business — p. 153 · Read the full section →
The strategy reset made concrete — the wind-down of the REAL VR-rehab platform and the impairment logic behind it.
Impairment trigger and the $33.4M inventory write-down on the immersive asset group.
During the three months ended June 30, 2024, the Company made the strategic decision to explore alternative avenues for its immersive healthcare business; as a consequence to this decision, the Company tested the immersive healthcare asset group’s longlived assets for impairment. Prior to the three months ended June 30, 2024, there were no events or circumstances that indicated the need to test for impairment.
The immersive healthcare asset group included substantially all the assets and liabilities associated with the immersive healthcare business, which primarily consisted of finite-lived developed technology intangible assets, inventory, and property and equipment associated with the developed technology. Prior to performing a recoverability test for the asset group, the Company recorded a $33.4 million charge to cost of revenue during the three months ended June 30, 2024 for the write-down of immersive healthcare inventory to net realizable value.
p. 154 · Read in context →
Penumbra, Inc. — FY2023 Annual Report (Form 10-K) — FY2023
Included for contrast: two years earlier Penumbra called itself a “global healthcare company” spanning five markets — including the immersive-VR business it has since abandoned. · Open the full document →
Item 1. Business — Overview — p. 8 · Read the full section →
The pre-reset self-portrait — a diversified therapies company with immersive healthcare listed alongside thrombectomy.
FY2023 identity: five markets, including “immersive healthcare market since 2020.”
Penumbra is a global healthcare company focused on innovative therapies. We design, develop, manufacture and market novel products and have a broad portfolio that addresses challenging medical conditions in markets with significant unmet need. Our team focuses on developing, manufacturing and marketing novel products for use by specialist physicians and healthcare providers to drive improved clinical and health outcomes. We believe that the cost-effectiveness of our products is attractive to our customers.
Since our founding in 2004, we have had a strong track record of organic product development and commercial expansion that has established the foundation of our global organization. We have successfully developed, obtained regulatory clearance or approval for, and introduced products into the thrombectomy market since 2007, access market since 2008, embolization market since 2011, neurosurgical market since 2014, and immersive healthcare market since 2020.
p. 8 · Read in context →
The REAL Immersive System — the VR-rehab platform later wound down and exited.
The REAL Immersive System is a proprietary, immersive 3D computer-based technology platform that has the potential to benefit patients over a broad range of healthcare applications, including rehabilitation, mental well-being and cognition. This technology builds on our experience with neuro and vascular medical device innovation and was initially commercialized for conducting upper body rehabilitation in a clinical setting. Studies have shown that adding virtual reality therapy to conventional therapy is effective in improving patient engagement and outcomes, particularly with systems that are fully immersive, customized for the healthcare setting, and fun and engaging for patients.
p. 18 · Read in context →
More annual reports
Penumbra, Inc. — FY2024 Annual Report (Form 10-K) — FY2024 · 192 pages · The transition year that carried the $115.3M immersive-exit charges and the resulting collapse in operating income. · Open →
Penumbra, Inc. — FY2022 Annual Report (Form 10-K) — FY2022 · 193 pages · Peak of the immersive push — the first full-body REAL system launched in Q4 2022, before the strategy reversed. · Open →
Penumbra, Inc. — FY2021 Annual Report (Form 10-K) — FY2021 · 203 pages · Earliest edition on the shelf, framing the pre-CAVT product portfolio and the year of the JET 7 Xtra Flex recall. · Open →
Source: S&P Capital IQ consensus via Xpressfeed · Generated 2026-08-03.
Earnings Cut, Revenue Held
Penumbra's forward tape splits in two. Analysts still model low-double-digit revenue growth through 2028, and revenue estimates have barely moved in six months. But the earnings line is being marked down: FY2028 normalized EPS consensus has slipped from $7.88 to $7.31, FY2027 from $6.43 to $6.20. The prints agree — six straight EPS beats, then misses in the last two quarters, the June quarter a -14.4% surprise. The Street sits mostly on Hold.
EPS estimates are being cut while the revenue line holds
FY2027 Revenue ($M)
FY2028 EPS now ($)
FY2028 EPS six months ago ($)
Latest quarter EPS surprise
Source: derived from vendor data.
The two forward years with point-in-time history tell one story. Normalized EPS consensus stepped down at every reading over the past six months — FY2028 from $7.88 to $7.31 (a -7.2% revision), FY2027 from $6.43 to $6.20 (-3.5%). Revenue did the opposite of moving: FY2027 sits at $1,802M today versus $1,801M six months ago (+0.1%), FY2028 at $2,043M versus $2,028M (+0.7%). Earnings, not the top line, are what analysts are rethinking.
Source: derived from vendor data.
Six straight EPS beats, then two misses
The revision cut is not happening in a vacuum — the prints turned. Penumbra beat normalized EPS for six consecutive quarters, several by double digits, then missed the last two: 1Q26 by -4.6% and 2Q26 by -14.4%. Revenue tells a gentler version of the same turn: beats that shrank from mid-single digits to essentially in-line by 2Q26. The top line arrived on plan; earnings did not.
The forward shape: low-double-digit revenue growth, wider earnings, thin outer years
Levels still describe a growth company. Consensus revenue climbs from $1,404M realized in FY2025 to about $2,043M by FY2028 — growth of 13.7%, 12.9% and 13.4% across the three years — while earnings compound faster still, up 23.6% in FY2026 and 30.7% in FY2027 as gross margin is modelled from 67.1% toward 70.7%. That operating leverage is exactly what the recent EPS cuts are trimming at the edges, not erasing.
Source: derived from vendor data. FY2025 is reported actual; FY2026 onward are consensus means.
Below the top line the dispersion widens with the horizon and coverage thins fast. FY2027 normalized EPS spans $5.12 to $7.06 across 13 analysts; by FY2029 only two analysts remain, and the current year, FY2026, is modelled by just five on the annual line.
Source: derived from vendor data.
The Street sits on Hold
Positioning is cautious rather than divided. Of 16 rated analysts, 13 are on Hold, with two Buys and one Outperform and no negative ratings. Price targets cluster tightly — a low of $320 against a high and median of $374, mean $361.58 — so the debate is about the size of upside, not its direction.
Source: derived from vendor data.
Target low ($)
Target mean ($)
Target high ($)
Source: derived from vendor data. Based on 12 price-target estimates.
For the driver-level broker models behind these lines — segment revenue, margin build and unit assumptions — see the Visible Alpha tab.
Visible Alpha broker models via S&P Xpressfeed · 16 brokers · 353 line items · freshest revision 2026-07-31.
Modeled Path
Brokers model Penumbra as a steady mid-teens grower whose earnings compound about twice as fast as its sales. Reported revenue growth eases from roughly 16% in FY-2025 toward 13% by FY-2028, yet operating diluted EPS climbs from $3.78 to $7.26 as the cost of revenue falls toward 29% of sales and EBITDA margin lifts from about 17% to 21%. Thrombectomy is the engine. The forward path rests on just three brokers.
The modeled endpoint
Total Revenue (FY-2028)
EBITDA Margin (FY-2028)
Operating Diluted EPS ($, FY-2028)
Free Cash Flow (FY-2028)
Source: derived from vendor data.
These are the FY-2028 waypoints of the consensus model: low-teens revenue growth, an EBITDA margin two-to-three points wider than today, operating earnings near double the FY-2025 level, and free cash flow that scales with them. Every forward figure on this tab is a three-broker view — read it as direction, not precision.
Thrombectomy carries the model
Penumbra reports in two product lines, and the models put almost all of the growth in one of them. Thrombectomy — the larger line, roughly two-thirds of revenue — is modeled to grow low-double-digits every year; embolization grows with it early but decelerates sharply, its reported growth falling from the mid-teens toward single digits by FY-2027.
Source: derived from vendor data.
The mix is also a geographic story. The United States is roughly four-fifths of revenue and the faster grower: US thrombectomy carries the highest modeled growth of any line, around 21% in FY-2025 easing to the mid-teens thereafter, while international revenue advances at a more modest pace.
Source: derived from vendor data.
The real story is operating leverage
Growth is only half of it. The models have earnings compounding faster than sales because unit costs fall: cost of revenue drops from about 33% of sales in FY-2025 toward 29% by FY-2028, and EBITDA margin rises in step from roughly 17% to 21%. This is the axis on which the earnings estimate is built.
Source: derived from vendor data.
The payoff is in the per-share line. Operating diluted EPS is modeled to move from $3.78 to $7.26 over the same span — a near-doubling on revenue that grows only about half as much, the signature of a business the models expect to lever its fixed base.
Source: derived from vendor data.
Consensus is tight on the top line; the debate is the out-year margin
Where brokers agree and where they don't is itself the signal. On the FY-2028 top line the three modelers cluster within a few percent of each other; the product-line splits are tight too. The disagreement lives in two places: the legacy neurovascular/vascular cut, which only two brokers carry and where they split almost two-to-one, and the out-year margin.
Source: derived from vendor data.
The margin debate is the one that moves value. The three brokers agree the EBITDA margin rises, but they widen apart on how far: by FY-2028 the low view sits near 19% and the high view above 24% — a five-point spread on a two-billion-dollar revenue base is real money, and it is the single most consequential unresolved line in the model.
Source: derived from vendor data.
The forward path rests on three brokers
The coverage thins abruptly as the model goes forward. Recent actual quarters carried fifteen or sixteen models; the estimate quarters that build the FY-2027 and FY-2028 picture carry two or three. The trajectory above is well-defined, but it is a small panel, and one revision can move it.
Source: derived from vendor data.
For the headline revenue and EPS consensus, its momentum and the beat/miss record, see the CapIQ tab; this page is the line-item and dispersion view beneath it.
Headline P&L consensus, momentum and beat/miss live in the CapIQ tab.
Source: S&P Capital IQ transcripts via Xpressfeed · latest indexed call 2025-11-05 · generated 2026-08-03.
Latest call digest
Penumbra, Inc., Q3 2025 Earnings Call, Nov 05, 2025 · 2025-11-05T21:30:00
Q3 2025 (call held Nov 5, 2025). The prepared remarks were unusually strong: total revenue of $354.7 million (+17.8% reported), U.S. VTE up 34%, U.S. embolization and access up 29.2%, gross margin of 67.8%, and a raised full-year revenue guide of $1.375 billion to $1.380 billion with U.S. thrombectomy reiterated at 20% to 21%. Management leaned into two catalysts — a positive STORM-PE randomized readout (presented at TCT/VIVA and published in Circulation) and the newly split, ~50-person dedicated embolization sales force that drove 21.2% sequential Embo growth. On Thunderbolt, they said they had submitted responses to all outstanding FDA questions in October and are in a final clarification phase.
The Q&A told a more guarded story. Analysts pressed hardest on Thunderbolt's FDA timing, and management stayed deliberately prudent — level-setting the review as normal for a brand-new neuro product and declining to commit to a clearance date. A second recurring push was on conservatism: several analysts questioned why the raised guide implies a sequential slowdown into Q4, and management declined to give any 2026 framing. Beneath the strong venous and embolization numbers, management acknowledged the U.S. stroke market showed a slight decline in the quarter, which they framed as a cyclical 'wave' rather than a share loss.
Participant coverage from the latest call.
| Group | Participants | Count |
|---|---|---|
| Management | Operator; Cecilia Furlong — Director of Business Development, Penumbra, Inc.; Adam Elsesser — Co-Founder, Chairman & CEO, Penumbra, Inc.; Shruthi Narayan — President, Penumbra, Inc.; Maggie Yuen — Chief Financial Officer, Penumbra, Inc. | 5 |
| Analysts | Travis Steed — Managing Director, BofA Securities, Research Division; Robert Marcus — Analyst, JPMorgan Chase & Co, Research Division; Larry Biegelsen — Senior Medical Device Equity Research Analyst, Wells Fargo Securities, LLC, Research Division; Joanne Wuensch — Managing Director, Citigroup Inc., Research Division; Vijay Kumar — Senior Managing Director of Equities, Evercore Inc.; Brandon Vazquez — Analyst, William Blair & Company L.L.C., Research Division; William Plovanic — Managing Director of Life Science Research, Canaccord Genuity Corp., Research Division; Michael Sarcone — Equity Analyst, Jefferies LLC, Research Division; Pito Chickering — Research Analyst, Deutsche Bank AG, Research Division; Ryan Zimmerman — MD & Medical Technology Analyst, BTIG, LLC, Research Division | 10 |
Curated latest-call exchanges; one row per analyst topic.
| Analyst | Firm | Topic | What changed in Q&A |
|---|---|---|---|
| Travis Steed | BofA Securities | Thunderbolt FDA process and launch timing | Asked whether Thunderbolt could be cleared by year-end; management level-set the review as normal for a brand-new neuro product and declined to commit to timing pending a clearance letter. |
| Robert Marcus | JPMorgan | U.S. thrombectomy deceleration and the stroke market | Asked if the year-long U.S. thrombectomy slowdown continues; management tied it to a soft stroke market offset by strong VTE, framing it as cyclical waves rather than a decline in their business. |
| Larry Biegelsen | Wells Fargo Securities | Embolization strength and implied Q4 deceleration | Questioned whether Q3 Embo strength was one-time and why the guide implies a Q4 slowdown; management said nothing was one-time and declined to give backdoor 2026 guidance. |
| William Plovanic | Canaccord Genuity | Guidance conservatism and FDA testing | Pushed on why the high end implies only ~2% sequential growth versus ~5% in prior years, and whether the FDA wants more data; management defended the conservative raise and stayed prudent on Thunderbolt. |
| Vijay Kumar | Evercore | STORM-PE practice change and SG&A step-up | Asked if STORM-PE is enough to change practice and about the sharp SG&A rise; management pointed to hospital protocol changes underway and said the embolization sales build-out is now complete. |
| Pito Chickering | Deutsche Bank | Market share versus market growth and new accounts | Asked to quantify new accounts and PER teams; management declined precise counts, saying a large share of growth was share gain and pointing to post-STORM conversion momentum. |
Theme tracker
Themes are curator-classified across supplied calls.
| Theme | Status | Quarters mentioned | Read-through |
|---|---|---|---|
| VTE-led CAVT thrombectomy growth | persisted | Q4 2023, Q1 2024, Q2 2024, Q3 2024, Q4 2024, Q1 2025, Q2 2025, Q3 2025 | U.S. VTE has led corporate growth every quarter, running near 40%+ from late 2024 through mid-2025 and 34% in Q3 2025; management repeatedly attributes it to Flash 2.0 share gains and calls the pattern non-linear. |
| Thunderbolt / THUNDER regulatory path | persisted | Q4 2023, Q1 2024, Q2 2024, Q3 2024, Q4 2024, Q1 2025, Q2 2025, Q3 2025 | Every call features a Thunderbolt update, moving from trial enrollment to FDA submission (Q1 2025) to active review (Q3 2025). Management has consistently refused to commit to timing and keeps Thunderbolt revenue out of guidance. |
| Conservative guidance philosophy | emerged | Q2 2024, Q3 2024, Q4 2024, Q1 2025, Q2 2025, Q3 2025 | After cutting 2024 guidance, management adopted an explicit conservatism, repeatedly citing lessons learned about not getting ahead of itself. It has since raised the 2025 guide each quarter. |
| China / international headwind | persisted | Q3 2024, Q4 2024, Q1 2025, Q2 2025, Q3 2025 | A multi-quarter China drag (as the model shifted from licensing to distribution) weighed on international results; by Q3 2025 management said the headwind is nearly minimal and other international regions returned to double-digit growth. |
| Gross margin path to 70% by end of 2026 | persisted | Q4 2023, Q1 2024, Q2 2024, Q3 2024, Q4 2024, Q1 2025, Q2 2025, Q3 2025 | A standing target reiterated every call, driven by CAVT product mix and manufacturing efficiency rather than price; gross margin reached 67.8% in Q3 2025. |
| STORM-PE randomized trial in PE | persisted | Q3 2024, Q4 2024, Q1 2025, Q2 2025, Q3 2025 | Discussed as the key clinical catalyst, moving from ongoing enrollment to completion (Q2 2025) to a positive readout at TCT/VIVA (Q3 2025). Management frames it as potentially standard-of-care changing for PE. |
| Dedicated embolization sales force split | emerged | Q1 2025, Q2 2025, Q3 2025 | A new theme in 2025: management split off a ~50-person embolization team so the peripheral team can focus solely on CAVT thrombectomy. It drove 21.2% sequential Embo growth in Q3 2025 and the build-out is now complete. |
| Immersive Healthcare wind-down | dropped | Q2 2024, Q3 2024, Q4 2024, Q1 2025 | The 2024 decision to exit Immersive Healthcare was a major strategic topic and later a cost-savings driver, but it fell out of active discussion by mid-2025, surviving only as a small non-GAAP reconciliation item. |
Guidance ledger
Quotes, calls, and speakers are source-verified; outcomes are curator-classified.
| Verbatim guidance | Call | Speaker | Curator outcome | Outcome note |
|---|---|---|---|---|
| “we introduced guidance for total revenue in the range of $1.230 billion to $1.270 billion, representing year-over-year growth of 16% to 20% compared to $1,058.5 million in total revenue in 2023.” | Penumbra, Inc., Q4 2023 Earnings Call, Feb 22, 2024 · 2024-02-22T21:30:00 | Jason Mills | missed | This original 2024 guide (and the 27% to 30% U.S. thrombectomy target) was cut mid-2024; full-year 2024 revenue landed near $1.2 billion, below the original range. |
| “Our updated guidance range for 2024 includes total revenue of $1.180 billion to $1.200 billion which is a reduction of $60 million at the midpoint from our previous guidance range.” | Penumbra, Inc., Q2 2024 Earnings Call, Jul 30, 2024 · 2024-07-30T20:30:00 | Jason Mills | kept | The reset 2024 guide held: management reported full-year 2024 revenue of $1.2 billion and U.S. thrombectomy growth of 26.8%. |
| “our total revenue guidance for 2025 is a range of $1.340 billion to $1.360 billion, which represents year-over-year growth of 12% to 14% compared to 2024 GAAP total revenue.” | Penumbra, Inc., Q4 2024 Earnings Call, Feb 18, 2025 · 2025-02-18T21:30:00 | Jason Mills | pending | This initial 2025 guide was subsequently raised each quarter through the year, reaching $1.375 billion to $1.380 billion by Q3 2025. |
| “we are increasing our guidance for total revenue to a range of $1.355 billion to $1.370 billion, which represents 13% to 15% year-over-year growth.” | Penumbra, Inc., Q2 2025 Earnings Call, Jul 29, 2025 · 2025-07-29T20:30:00 | Jason Mills | pending | Raised again the following quarter to $1.375 billion to $1.380 billion; full-year 2025 outcome not yet known as of the latest call. |
| “we are raising our revenue guidance for the year to $1.375 billion to $1.380 billion. We reiterate 20% to 21% year-over-year growth for 2025 for U.S. thrombectomy.” | Penumbra, Inc., Q3 2025 Earnings Call, Nov 05, 2025 · 2025-11-05T21:30:00 | Adam Elsesser | pending | Most recent guide; full-year 2025 results not yet reported. Analysts noted the high end implies a sequential slowdown into Q4. |
| “remain well-positioned to deliver our long-term gross margin profile of 70% by the end of 2026.” | Penumbra, Inc., Q3 2025 Earnings Call, Nov 05, 2025 · 2025-11-05T21:30:00 | Maggie Yuen | pending | Standing multi-year target reiterated across calls; the end-of-2026 milestone is beyond the supplied call history. |
Q&A pressure map
Question counts and firms are curator tallies; analyst coverage shown above.
| Topic | Questions | Firms | Pressure / response |
|---|---|---|---|
| Thunderbolt FDA timing and clearance | 7 | BofA Securities, Canaccord Genuity, BTIG, Wells Fargo Securities | The most persistently pressed topic across the Q2 and Q3 2025 calls. Management repeatedly declined to give a clearance timeline, saying it does not control the FDA process and will stay prudent until it has a clearance letter — a conservative non-answer rather than an evasion of substance. |
| Guidance conservatism and implied deceleration | 6 | Canaccord Genuity, Wells Fargo Securities, BofA Securities, Truist Securities, Deutsche Bank | Analysts repeatedly asked why raised guides imply sequential deceleration despite strong beats; management defended the conservatism and declined to give forward 2026 framing. |
| STORM-PE clinical impact and adoption pace | 6 | BofA Securities, Evercore, William Blair, Jefferies, Deutsche Bank | Heavily probed on the Q3 2025 call — whether the data changes practice and how fast adoption follows. Management answered directly, pointing to hospital protocol updates and early conversions. |
| Stroke market softness / U.S. thrombectomy deceleration | 4 | JPMorgan, Truist Securities, William Blair | Analysts questioned the softening U.S. stroke market and decelerating U.S. thrombectomy; management acknowledged the soft stroke market but framed it as cyclical while continuing to take share. |
| Margins and operating leverage | 5 | JPMorgan, Evercore, Piper Sandler, BTIG | Recurring questions on the path to 70% gross margin and SG&A leverage after the sales-force build-out; management attributed expansion to CAVT mix and efficiency, not price, and said the investment phase is complete. |
Language shifts
Only language evidence verified against the referenced component is shown.
| Observation | Verbatim evidence | Call ID | Component |
|---|---|---|---|
| The explicit birth of a conservative guidance stance after the 2024 cut — a deliberate shift away from the company's historically aspirational guiding. | “Going forward, our guidance will reflect a comfortable level of conservatism.” | 1886540871 | 2 |
| A year later, management still invokes the 2024 miss as a self-check on optimism, signaling the conservatism is durable rather than a one-quarter posture. | “we still have fresh memories of having our enthusiasm get the better of us, and we're going to try not to do that.” | 1951480879 | 25 |
| New caution vocabulary about the core stroke market surfaced in Q3 2025, an acknowledgment absent from the confident stroke commentary of prior quarters. | “Recent market trends in the macro U.S. stroke market showed a slight decline in the third quarter.” | 1964400815 | 2 |
| Confidence on the PE clinical thesis hardened once STORM-PE read out — language moved from conditional ('if positive') to definitive claims of superiority. | “STORM-PE proved CAVT superior to the current standard of care across the primary as well as multiple secondary endpoints” | 1964400815 | 3 |
The call history shows a company that reset its own credibility after over-promising in early 2024, then strung together in-line-to-raised quarters under a deliberately conservative guide. For the current debate, two threads dominate: Thunderbolt's uncertain FDA timing, which management keeps out of guidance, and whether the positive STORM-PE readout converts into faster PE-market growth — a potential offset to a stroke market that management has just conceded is softening.
Competitors describe Penumbra, Inc.'s market in their own filings and calls. These verified passages and visual pages show where their strategies meet, using source documents preserved in Sources.
Boston Scientific Corporation (BSX)
The most consequential name in the set: on January 15, 2026 Boston Scientific agreed to acquire Penumbra outright for roughly $14.5 billion. BSX already fields overlapping venous/pulmonary thrombectomy tools (AngioJet, EKOS) inside its Peripheral Interventions business, and its own filings and calls describe Penumbra's business, portfolio and the strategic logic of the deal in detail — a competitor turned acquirer.
Boston Scientific's 10-K formally discloses the agreement to acquire Penumbra — describing the subject's business (thrombectomy for peripheral vascular clot removal), naming its Lightning Bolt and Lightning Flash CAVT systems, and putting the price at $374 per share / ~$14.5 billion.
On January 15, 2026, we announced our entry into a definitive agreement to acquire 100 percent of Penumbra, Inc. (Penumbra), a publicly traded medical technology company primarily focused on innovative medical thrombectomy products for use in peripheral vascular procedures in the removal of blood clots and blockages. The Penumbra portfolio includes the Lightning Bolt™ and Lightning Flash™ Computer Assisted Vacuum Thrombectomy (CAVT™) Systems. The purchase price is valued at $374 per share, or approximately $14.500 billion. The transaction is expected to close during 2026, subject to customary closing conditions.
p. 9 · Read in context →
On the Q4 2025 call, a Boston Scientific executive frames the strategic rationale — the Penumbra deal as an entry into the 'high-growth' pulmonary embolism and neurovascular markets, layered onto BSX's existing scaled vascular sales force.
The announcement of Penumbra, as we talked about, is really exciting for us. It gets us into new high-growth markets in PE and neurovascular, just to name a few, with a highly scaled sales force. So in terms of commercial clinical capability, I think we're pretty unmatched in that area.
p. 9 · Read in context →
Q1 2026 deal-timing update: BSX expects the Penumbra acquisition to close in the second half of 2026, pending Penumbra's May 6 shareholder vote and remaining regulatory clearances.
We remain excited about the opportunity to combine the Penumbra team and their highly differentiated portfolio with Boston Scientific. We anticipate that the deal will close in the second half of '26, subject to the Penumbra shareholder vote on May 6 and the receipt of the remaining regulatory clearances.
p. 3 · Read in context →
Medtronic plc (MDT)
Medtronic's Neurovascular operating unit is the classic head-to-head competitor in acute ischemic and hemorrhagic stroke — the exact clinical space of Penumbra's aspiration-thrombectomy franchise — with a coils, neurovascular-stent and flow-diversion portfolio sitting inside a ~$10 billion Neuroscience segment.
Medtronic's FY2026 10-K places Neurovascular as a distinct operating unit whose products treat 'acute ischemic and hemorrhagic stroke' — the same indication Penumbra's neuro thrombectomy business targets.
Our Specialty Therapies division includes the following Operating Units: Neurovascular; Ear, Nose, and Throat (ENT); and Pelvic Health. The division develops, manufactures, and markets products and therapies to treat patients afflicted with acute ischemic and hemorrhagic stroke, ENT diseases, and patients suffering from overactive bladder, and (non-obstructive) urinary retention.
p. 11 · Read in context →
Medtronic's neurovascular product line — coils, neurovascular stents and flow-diversion devices for the brain vasculature — disclosed within a Neuroscience segment reporting $10.3 billion of FY2026 net sales.
Neuroscience's products also focus on therapies to treat the diseases of the vasculature in and around the brain, including coils, neurovascular stents, and flow diversion products, as well as products to treat the ear, nose, and throat (ENT), and the treatment of overactive bladder and urinary retention. […] Neuroscience’s net sales for fiscal year 2026 were $10.3 billion, an increase of 4 percent as compared to fiscal year 2025
p. 68 · Read in context →
Stryker Corporation (SYK)
Stryker names Penumbra directly as one of five leading global competitors in its Vascular / Neuro Cranial business, which sells minimally invasive devices for acute ischemic and hemorrhagic stroke and venous thromboembolism — and on its earnings call claims to be the largest neurovascular player in the market.
Stryker's FY2025 10-K lists Penumbra by name as one of the five leading global competitors in its Vascular and Neuro Cranial business, alongside Medtronic, J&J MedTech and Terumo.
We are one of five leading global competitors in Vascular and Neuro Cranial; the other four being Medtronic, Johnson & Johnson MedTech, Terumo Corporation and Penumbra, Inc.
p. 3 · Read in context →
On the Q4 2025 call, Stryker management claims market leadership in neurovascular — the category where Penumbra competes — stating it became the largest player roughly a year earlier.
But our hemorrhagic business continues to be very strong, and we are now the largest neurovascular player in the marketplace. We took over leadership roughly about a year ago and have continued to be the largest player.
p. 5 · Read in context →
Johnson & Johnson (JNJ)
Through its MedTech Cardiovascular portfolio, J&J offers neurovascular care that treats stroke via minimally invasive, catheter-based approaches used by neurointerventional specialists — the same call point and procedure Penumbra sells into.
J&J's FY2025 10-K situates its neurovascular stroke-care business within MedTech Cardiovascular, delivered through the same minimally invasive catheter-based approach and to the same neurointerventional specialists that Penumbra targets.
circulatory restoration products (Shockwave) for the treatment of calcified coronary artery disease (CAD) and peripheral artery disease (PAD), and neurovascular care that treats stroke and other conditions. These offerings are primarily delivered through minimally invasive, catheter based approaches and are used by interventional cardiologists, electrophysiologists and neurointerventional specialists.
p. 10 · Read in context →
AngioDynamics, Inc. (ANGO)
AngioDynamics competes squarely with Penumbra's peripheral mechanical-thrombectomy franchise through its AlphaVac / AngioVac thrombus-management portfolio, and names Penumbra directly in both its 10-K competition section and its management's discussion of the thrombectomy landscape.
AngioDynamics' competition section names Penumbra among its primary competitors, alongside Boston Scientific, Medtronic, Stryker and other large device makers.
We encounter significant competition across our product lines and in each market in which our products are sold. […] Our primary competitors include: Boston Scientific Corporation; Cook Medical; Medical Components, Inc. (MedComp); TeleFlex Medical; Becton Dickinson; Medtronic; Merit Medical; Terumo Medical Corporation; Johnson and Johnson; Philips Healthcare; Stryker Corporation; Penumbra, Inc.; Varian Medical Systems; Abbott Laboratories and Total Vein Systems.
p. 15 · Read in context →
AngioDynamics' Thrombus Management portfolio — the AlphaVac Mechanical Thrombectomy System and AngioVac — addresses the same venous/peripheral clot-removal use case as Penumbra's CAVT devices.
Our Thrombus Management portfolio includes the AlphaVac Mechanical Thrombectomy System, AngioVac venous drainage cannula and circuit, as well as catheter directed thrombolytic devices, including the Uni-Fuse system and the Uni-Fuse+ system. AngioDynamics offers a range of options when treating thrombus and removing fresh, soft thrombi or emboli.
p. 7 · Read in context →
On the Q4 FY2026 call, AngioDynamics' CEO characterizes the thrombectomy field — grouping Boston Scientific/Penumbra and Inari/Stryker as the go-to-market forces its own products compete against.
You now have Boston and Penumbra going to market differently than it was in the past. You've got Inari and Stryker going to market differently. Our product competes really well with both of those. Those are great products and great companies behind them, but our product is really good.
p. 8 · Read in context →
More peer documents
Boston Scientific FY2024 10-K — stroke / Peripheral Interventions baseline (pp.8, 12) — 215 pages · Pre-acquisition snapshot of BSX's thrombectomy and stroke-adjacent portfolio, to gauge what Penumbra adds versus what BSX already had. · Open →
Stryker FY2024 10-K — Neurotechnology competitor list (p.4) — 112 pages · Prior-year version of the same 'five leading competitors' framing that names Penumbra, to confirm the competitive-set language is consistent year over year. · Open →
Medtronic Q3 FY2026 call — neurovascular / thrombectomy positioning (pp.8-9) — 32 pages · Management names thrombectomy and carotid stenting among categories where it is 'well positioned'; a read on how MDT talks about the stroke market it shares with Penumbra. · Open →
Johnson & Johnson Q4 FY2025 call — stroke / aspiration references (pp.12-15) — 15 pages · Cardiovascular/MedTech commentary touching stroke and aspiration, for J&J's live framing of the neurovascular opportunity. · Open →
Terumo Corporation (TSE:4543) — financial statements only — 1 page · Terumo (MicroVention) is a genuine neurovascular competitor and is named alongside Penumbra by Stryker, but the corpus holds only its financial-statement PDFs — no annual report or transcript to quote from. · Open →
Fit
Does not fit the framework (P1 not met); contested: P5.
Penumbra clears the universe (NYSE common stock, ~$12.62B market cap) but fails the one pure gate: the year-10 durability test. The revenue leg of that gate is a high-conviction call, but the year-10 adjusted-FCF-higher leg carries genuine doubt — positive adjusted free cash flow is only three years old against three larger, consolidating competitors — and a signed Boston Scientific takeover at $374/share removes the standalone decade entirely. One exclusion also fires: the market-darling screen (X4). Confidence is low, because the diagnosis criterion (P5) is contested with a 0.26 probability spread, above the framework's 0.25 line.
The answer, in one screen
The gate decides it. The setup, the yield, the balance sheet and the diagnosis below are real analysis, and none of it offsets a failed P1 — that is the framework's own rule: P1 not_met -> does_not_fit (gate; nothing offsets it). What makes this name unusual is that the price is not in a dislocation at all: at $321.19 the stock sits 5.7% above its February-2025 peak and 14% below a $374 strategic bid, so a buyer today underwrites a merger-arbitrage spread, not a fear-repriced value gap.
Market cap ($B)
Adjusted FCF yield (FY2025)
Fortress-class bar (low end)
Trial P(temporary)
Sources: market cap 39,291,828 shares × $321.19 (2026-07-31); adjusted FCF yield derived from the FY2025 statement of cash flows [1]; the trial probability from the report's adversarial diagnosis trial. Adjusted FCF = reported FCF − stock-based comp − 5-yr avg acquisition spend.
Universe and exclusions
Universe — clears both lines. Penumbra is ordinary U.S. common stock listed on the NYSE (ISIN US70975L1070), incorporated and headquartered in Alameda, California — not an ADR and not a Chinese issuer, so U1 passes. At the $321.19 close on 2026-07-31 the 39,291,828 shares put market cap at $12.62B, roughly 26% above the $10B floor, so U2 passes [2]. The pass is not comfortable: the cap sits only 26% over the line and rests on a price already lifted by the takeover bid — the undisturbed pre-announcement market cap (~$11.8B at $300.97 on 2026-01-13) was closer to the threshold.
One exclusion fires — the market-darling screen (X4). This is a genuine hit, and it leads. Penumbra carries darling positioning: ~9.0x standalone revenue and ~10.3x EV/revenue (~83x EPS at the deal price), a ~20% ten-year revenue CAGR with no down year, and a bottom-left-to-top-right chart that consensus and an acquirer both love [3]. It is not the most extreme multiple-to-sales name in premium medtech, and FY2024 GAAP net income was just $14.0M after a $76.9M impairment — but the screen the framework runs (a consensus-owned secular-growth story on premium multiples) is exactly what fires here.
The other four exclusions do not fire. Penumbra is a pure medical-device manufacturer — single-use vascular catheters and clot-removal systems sold to hospitals — with no automotive or OEM exposure, so the car-company exclusion (X1) does not apply. Management's record shows one FY2024 guidance miss, acknowledged and followed by a string of 2025 beats and raises, not a promotional serial-miss pattern (X2 does not fire), though founder-CEO Elsesser owns just 1.9% and insiders 2.9% with no open-market buying [4]. Revenue rose in all ten years on record, so the structural-decline exclusion (X3) is absent. China is served through a technology-licensing arrangement inside the ~10% distributor channel; total international revenue is $311.9M (22.2% of company), so the China-dependence sensitivity (S1) is a name to flag, not a dependence.
Pattern match
Of the framework's four setups, Penumbra is closest to a quality tech/medtech franchise on a fear dip — an essential, category-leading device maker whose stock fell 25.8% in 2025. But it fails that pattern's entry checks and reverses one of them. The 2025 fear-dip has fully round-tripped: the stock closed above its February peak by December and now trades near all-time highs, so the fear window is closed, not open. And the specific fear the pattern looks for — testable and temporary — is here entangled with a real growth-algorithm question (thrombectomy deceleration) rather than a passing scare. It is emphatically not the healthcare/insurance forecasting-error pattern (no 1:1 guidance-cut anchor; guidance was beaten, then withdrawn for the deal), not cyclicals-at-the-bottom, and not a monopoly with franchise pricing power. It fits none of the four cleanly.
The pillar ledger
Source: deterministic fit tally; per-criterion arithmetic from the surviving claim ledgers cited in each section below.
Year-10 gate (P1) — the decisive result
Not met. All four jury seats and the name-masked seat returned not_met; the trimmed-mean year-10 probability is 0.55 with a spread of 0.24 — cross-family agreement. The split inside the gate is the point. Year-10 revenue higher is a high-conviction call: revenue has risen for ten straight years, from $263.3M (2016) to $1,403.7M (2025), a ~20.4% CAGR into a still-mostly-untreated stroke market (~200,000 of ~700,000 annual U.S. ischemic strokes are thrombectomy-treatable, most untreated today) [5] [6]. What cannot be asserted with very high conviction is year-10 adjusted free cash flow: positive adjusted FCF is only three years old — $31.6M / $101.1M / $115.7M in 2023–2025 — against three larger competitors (Boston Scientific, Medtronic, Stryker now including Inari Medical, Terumo) that can outspend Penumbra on development and marketing [7] [8]. Penumbra's moat is IP, clinical evidence and execution over a ~22-year history rather than the dominant scale, regulatory-entry barrier, or capital intensity the framework prizes; execution is not a moat. Under the framework, any proper doubt resolves the gate to not met, and a signed $374 takeover means there is no standalone Penumbra equity to hold in year 10 regardless. Full treatment: the Durability tab.
Strongest counter-fact: gross margin ~67%, no debt, and operating income up from $6.1M (2022) to $189.2M (2025) argue a much larger business a decade out generates more cash, not less — the revenue leg is not in doubt, and consensus revenue still climbs toward ~$2.04B by FY2028. It moves the volume question; it does not settle the year-10 cash question with very high conviction, and no consensus estimate reaches year 10.
FCF consistency (P2) — not met
Not met. The deterministic fcf_stability feature is not_computable (fewer than five consecutive positive adjusted-FCF years; stock-based comp absent from the feed), so the test was run by hand on the filed statements [9]. Reported FCF was negative or near-zero in six of the ten years through 2022 (−$26.4M, +$0.2M, +$19.2M, +$4.5M, −$58.0M, −$11.7M, −$75.0M) before inflecting to +$82.1M / +$147.3M / +$174.9M in 2023–2025. A stable rolling five-year average has not yet formed. Counter-fact: the inflection is mechanistically durable — revenue scaling over a largely fixed cost base drove the operating-income jump — and it is a one-directional growth-investment curve, not the every-5-to-8-years underwriting dip the framework tolerates for insurers and banks. Detail on the Yield tab.
Dislocation and yield (P3a, P3b, P3c, P3d)
The setup is the reverse of the framework's. P3a is not met: the 2025 drawdown had no dated adverse trigger — the stock fell 25.8% from its 19 Feb 2025 peak ($303.76) to its 5 Nov 2025 trough ($225.54) while every quarter beat consensus (EPS surprises +8.5%, +24.5%, +4.7%), and the only dated event that repriced it was the opposite of adverse, the 15 Jan 2026 Boston Scientific agreement [10]. P3b is met — the peak-to-trough leg printed a volume spike of 2.07x the pre-peak 180-day median, clearing the ≥2x capitulation reference line — though the Dislocation tab reads 2.07x as a modest, orderly bleed rather than a washout, and the drawdown has since fully round-tripped, so the reading is moot for a buyer today. On valuation the gap is an order of magnitude: FY2025 adjusted FCF yield computes to 0.92% — 708 to 808 bps below the 8–9% fortress bar — because adjusted FCF ($115.7M) sits against a $12.62B cap (a ~109x price-to-adjusted-FCF multiple), so P3c is not met [11]. The balance sheet is fortress (net cash), which selects the 8–9% bar, not the 10% default [12]. The forward path is not met at p=0.02: consensus forward FCF yields only ~1.4% (FY2026) rising to ~2.4% (FY2028) on the current cap, so no mean-reversion to the bar exists within 1–3 years — reaching 8% would take ~$1.0B of adjusted FCF against ~$116M today, an 8.7x rise. Counter-fact: consensus FCF is rising, not falling ($173M → $300M FY2026–FY2028), and the sell side is not fearful — but rising conversion on 17%+ growth is exactly what a ~109x FCF multiple already pays for (Yield).
Balance sheet and self-help (P4a, P4b, P4c)
Outlast (P4a): met. Penumbra carries no borrowings and ~$545M of cash and marketable investments; total liabilities are entirely payables, accruals and leases (~$27M annual lease payments against $238.7M operating cash flow), so it can outlast any operating problem with no forced debt paydown [13]. The allocation-headroom half of the pillar is now moot: the pending merger bars repurchases and new debt without Boston Scientific's approval [14].
Repurchase engine (P4b): not met. The share count rose every year — diluted shares 33.5M (2016) to 39.3M (2025), +17.4% — driven by $46–59M of annual stock-based compensation, and the sole buyback was a single $100.4M ASR in 2024 at ~$194/share [15] [16]. A rising share count on SBC with no shrinking-count engine is the specific pattern the framework excludes from the self-help pillar — the same mechanism that drops Accenture once adjusted — and the buyback flywheel is legally frozen by the merger besides. The absurdity check runs the wrong way: at the current price it would take ~72 years of raw FCF (or ~109 adjusted) to retire the float, the inverse of the ~3-year signature the check is built to catch. Counter-fact: the one buyback was executed at ~$194, well below the current $321 close and the $374 takeout, and the deal itself values the equity above any price it has ever traded — shareholders are being rescued by a buyer even though self-help is off the table. Dividend cover (P4c) is not_applicable: Penumbra has never paid a dividend and does not anticipate one. Detail on Self-Help.
Diagnosis (P5) — contested
Contested. This is the criterion that pins confidence at low. The independent trial put the probability the post-2024 reset is temporary at P(temporary) = 0.61 (mean 0.57), but the panel is genuinely split: the spread is 0.26 (above the framework's 0.25 line) and the ruling is reading-order sensitive — the judge who read the temporary brief first landed at 0.42, below 0.5, while the permanent-first judges averaged 0.645, a 0.225 order gap. The near-term earnings hit behind the drawdown was close to zero — consensus rose and every quarter beat through the fall — so at the November trough the ~$3.07B of erased market value was a genuine mispricing against a ~$0 earnings basis. The genuine damage arrived later and landed on margin, not sales: Q2 2026 EPS missed 14.4% as first-half SG and A expense rose to $391.3M and operating income slipped even as revenue grew 15.3%, and the line under question is core thrombectomy growth decelerating ~20% → 16% → 12.3% [17] [18]. Both sides are laid out on the Damage Math tab; the ruling is carried as contested and not overridden. Counter-fact: management frames the SG and A step-up as a completed sales-force build after which operating leverage should appear — if true, that converts the margin hit from structural back to timing and tilts the diagnosis temporary; even capitalized, the permanent EPS shave is modest (~$0.3–0.5B, roughly 2–4% of the current cap).
Instrument context (I1) — not verifiable
The tally records I1 as not_verifiable. Listed options exist on PEN (a $12.6B optionable NYSE name), but a current implied-volatility level could not be sourced — options-data pages returned access-denied and the web-research preload failed — so no IV is estimated. The pending fixed-price merger has collapsed 30-day realized volatility to ~5.7% (2026-07-31) against a ~37% historical median, consistent with a stock pinned to a $374 deal. This criterion never blocks the pillar verdicts; here it is moot, because the P1 gate already decides the fit. Full instrument facts on the Clock tab.
What a 3x-in-3-years would require
The tally did not compute a re-rating price: "Re-rating math unavailable because the applicable bar or normalized adjusted FCF is missing." The balance-sheet-scaled bar resolves to fortress (8–9%), but framework-adjusted, normalized adjusted FCF is not_computable in the feature file (stock-based comp absent from the XBRL cash-flow feed across all years), so there is no adjusted-yield anchor to invert into a target price.
What can be said, as framework arithmetic rather than a target: at the low end of the 8% fortress bar, the equity would need roughly $1.0B of adjusted FCF to justify today's $12.62B cap on yield alone — against $115.7M produced in FY2025, an 8.7x rise — and consensus forward FCF reaches only ~$300M by FY2028. A 3x re-rating from here is not a yield-driven proposition; it would require the market to pay an even higher multiple on a much larger cash base, on a name already trading at ~109x adjusted FCF. The base-rate context from the Clock tab is a reminder that this name can swing hard — its two deepest historical drawdowns were −63% (2021, ~24 months to round-trip) and −52% (2023, ~31 months) — but the most recent recovery was completed by the January 2026 takeover, not by operating re-recognition: the day before the deal the stock was still ~9% below its 2023 peak. None of this is a recommendation; the gate has already ruled the name out.
Contested and undetermined
One criterion is recorded contested: P5, the diagnosis. Both model families returned contested; the split is real (probability 0.61, spread 0.26, order gap 0.225) rather than a labelling artifact, which is why it is carried as contested and not rounded to a clean temporary reading. Nothing was marked cannot-determine: every pillar reached a verdict, and the features that could not be computed (adjusted FCF, adjusted-FCF yield, FCF stability, float-retirement years, balance-sheet class) were rebuilt by hand from the filed FY2025 statements rather than left open. The exclusions were not contested here — X1, X2, X3 and S1 were unanimously not_met and X4 unanimously met (the darling screen fired) across both families and the masked seat.
Provenance
Source: fit tally provenance block and the adversarial trial tally.
Two families of models voted, and they agreed on the verdict that matters — the year-10 gate failed on every seat, masked and unmasked. The name-mask probe moved nothing (no gate criterion changed, zero probability gap), so the answer is not a prior in disguise. Confidence is nonetheless low, and honestly so: the diagnosis that would decide whether the 2025 dislocation was ever a real mispricing is contested, with judges landing on both sides of even money depending on which brief they read first.
Falsifier ledger
These are the standing what-would-change-this conditions carried from the jury and the diagnosis trial's flip-conditions. They are redundant by design — harvested independently from multiple seats — and reproduced verbatim so each threshold, direction, and window stands on its own:
Data gaps
The run could not answer several things, and the verdict is stated with them in view. The deterministic feature file could not compute adjusted FCF, adjusted-FCF yield, FCF stability, yield baseline, float-retirement years or balance-sheet class — stock-based compensation was absent from the XBRL cash-flow feed for every year and the balance-sheet debt/cash fields were null — so every adjusted figure was rebuilt by hand from the filed FY2025 statement of cash flows (SBC $59.2M) and the balance sheet (zero borrowings, net cash confirmed directly). Revenue before FY2023 was reconstructed from segment US+international totals because income.json carried null revenue. There is no reported short-interest series for PEN (FINRA returned none), and no 2025-dated consensus-revision snapshot, so the estimate-versus-price lead/lag through the drawdown is inferred from consistent beats. A current implied-volatility level and long-dated option-chain detail could not be verified (options pages returned access-denied; the web-research preload failed; the tech feed provides realized volatility only). Finally, the merger's antitrust status — the FTC Second Request (2026-03-16), EU/other non-U.S. clearances, the reverse termination fee, and the updated close timing — is web-sourced (Boston Scientific Form S-4/424B3, MLex) and is not restated in the corpus PDFs, which predate the Second Request.
Penumbra makes minimally invasive devices that pull blood clots out of vessels — stroke, pulmonary embolism, deep-vein thrombosis — plus embolization and vascular-access tools, from one U.S. base at ~$1.4B revenue growing ~20% a year. It clears the universe screen (NYSE common stock, $12.6B cap), is not an auto or Chinese name, but carries darling-grade multiples. The orienting fact: on January 14, 2026 it signed a definitive merger to be acquired by Boston Scientific at $374 a share.
What Penumbra is
Penumbra designs, builds and sells catheters and mechanical systems that remove clots and occlude vessels from inside the bloodstream. Founded in Alameda, California in 2004 and public on the NYSE since 2015, it treats a defined set of life-threatening vascular conditions — ischemic stroke, pulmonary embolism (PE), deep-vein thrombosis (DVT), acute limb ischemia, plus aneurysms and hemorrhagic stroke [1]. In two sentences: it is a focused U.S. medical-device maker that pioneered computer-assisted vacuum ("aspiration") thrombectomy and now competes across the neuro and peripheral vascular field; it sells consumable devices to hospitals, ~90% through its own direct sales force, and books the whole company as one operating segment [2].
FY2025 revenue
FY25 revenue growth
U.S. revenue share
Employees
Sources: FY2025 10-K, Consolidated Statements of Operations and geographic disaggregation [3]; headcount [4].
Revenue splits two ways. By product, thrombectomy — the clot-removal franchise led by the Indigo and Penumbra systems — generated $947.9M in 2025, and embolization and access (coils, occlusion devices, guide catheters) generated $455.7M [5]. By geography, the United States accounted for $1,091.8M and all international markets $311.9M [6]. The business is a razor-and-blade consumables model: single-use catheters and systems used per procedure, manufactured almost entirely in-house at Alameda and Roseville, California, with a new plant under construction in Costa Rica [7].
Source: derived from reported figures, FY2021–FY2025 10-Ks (revenue = gross profit + cost of revenue); FY2025 10-K Consolidated Statements of Operations [8].
The shape is a clean growth chart: revenue up roughly fivefold over the decade, a ~20% compound rate, with no down year. Profitability has lagged and lurched — GAAP net income was negative or near-zero in most years through 2022 (FY2024 alone carried a $76.9M impairment and heavy inventory write-downs), then jumped to $177.7M in 2025 as the top line and gross margin recovered. This is a business whose value has always been priced on growth and market opportunity, not on current cash returns.
The Boston Scientific merger
The dominant fact about Penumbra today is that it has agreed to sell itself. On January 14, 2026 it signed a definitive Agreement and Plan of Merger with Boston Scientific Corporation — one of its own named competitors — at an enterprise value of approximately $14.5 billion, valuing each Penumbra share at $374, payable ~73% in cash and ~27% in Boston Scientific stock (3.8721 shares per Penumbra share, subject to proration) [9]. The deal is expected to close by the end of 2026, subject to Penumbra stockholder and regulatory approval [10]; as of mid-2026 it had board approval from both sides and remained pending those approvals.
That reframes the stock. At the $321.19 close on July 31, 2026, Penumbra traded about 14% below the $374 cash-equivalent deal value — a merger-arbitrage spread reflecting time-to-close, deal risk, and the floating Boston Scientific stock leg, not a market judgment on the standalone business. The price sits near the top of its range and above where it traded before the announcement: shares had fallen from a $303.76 peak (February 2025) to a $225.54 trough (November 2025), a −26% drawdown, then re-rated on the January bid. There is no forced-selling capitulation here; the anatomy of the tape belongs to the Dislocation and Clock tabs, but the orienting point is that the price today is a claim on a takeout, and in year 10 the company will not exist as an independent public entity.
Market structure
Penumbra sits in the neuro-and-peripheral-vascular device market as the focused innovator, not the incumbent. Its own filing names its most notable competitors as Boston Scientific, Medtronic, Stryker (now including Inari Medical), and Terumo, plus several private companies, and describes them plainly as "large, well-capitalized companies with longer operating histories and greater resources than we have" [11]. Stryker's 2025 acquisition of Inari Medical — a direct PE/DVT thrombectomy competitor — and now Boston Scientific's move on Penumbra itself show the giants consolidating the space around them.
The market is best read as an oligopoly of diversified large-caps into which Penumbra has carved a product-leadership position — the opposite of the dominant, price-setting incumbent the framework prizes for year-10 durability. The countervailing evidence is real: the clinical need is genuinely essential and the addressable market is large and under-penetrated. Penumbra cites approximately 2.15 million clot incidences a year in the United States alone, "the vast majority of which do not currently receive mechanical thrombectomy intervention" [12], and roughly 200,000 of ~700,000 annual U.S. ischemic strokes as treatable by thrombectomy [13].
The moat pillars the Durability tab will weigh cut both ways. Regulatory entry barriers exist — FDA 510(k)/PMA clearance, CE marking, ISO 13485 quality systems — but they gate every competitor equally and the larger players clear them routinely. Capital intensity is moderate (in-house manufacturing, $63.7M of FY2025 capex) rather than a fortress-scale barrier. The operating history is ~22 years — real, but short of the 30–50-year franchises the framework leans on. What protects Penumbra is intellectual property, accumulated clinical evidence, and physician relationships — an execution-and-innovation moat, which the framework treats as weaker than structural or regulatory-entry protection. The essential product and expanding TAM support higher year-10 revenue; the challenger position, the youth, and the pending absorption into a competitor argue against very high conviction on a standalone basis.
Universe screen
Penumbra clears both gates. U1 (geography): it is a U.S.-domiciled company headquartered in California, listed on the NYSE under common stock (CUSIP/ISIN US70975L1070) — not an ADR, not a Chinese issuer [14]. U2 (market cap): at $321.19 on July 31, 2026 across 39.29M shares, the market capitalization is $12.62B, above the >$10B line — a clean pass, roughly 26% above the threshold, with the pending deal implying a $14.5B enterprise value.
Source: market cap from fit_features (price $321.19 on 2026-07-31 × 39.29M shares); listing facts per the FY2025 10-K cover and Overview cited above.
Exclusion screen — first pass
X1 — auto/OEM: clear. Penumbra is a pure medical-device manufacturer; no automotive exposure.
X4 — consensus darling: flagged. Penumbra carries the darling signature the framework screens out. Standalone, the $12.62B cap is ~9.0x FY2025 revenue; the $374 deal price is ~10.3x revenue on enterprise value and ~83x FY2025 GAAP EPS of $4.52 — premium, high-growth medtech multiples, not value multiples. The chart is textbook bottom-left-to-top-right (revenue up ~5x in a decade, no down year), and the story is a secular-growth, "this changes stroke care" narrative that a strategic acquirer has now validated with a takeover premium. The counter-facts: the standalone multiple sat below the very top of premium medtech (names such as Intuitive Surgical trade richer), FY2024 GAAP earnings were near zero on impairments, and the stock now trades as a merger-arb spread rather than on momentum. Even so, the positioning — richly valued growth compounder that consensus and now an acquirer love — is the profile of a name where a fear-driven dislocation buyer has no edge.
S1 — China exposure: immaterial. Penumbra has no material China revenue or asset dependence. It sells ~90% of revenue through its own direct sales force; China is served through a technology-licensing arrangement with a local distribution partner (fixed payments plus royalties), embedded within the ~10% of revenue that runs through distributors [15]. With total international revenue of $311.9M (22% of the company) spread across Europe, Canada, Australia, Singapore and distributor markets [16], China is a small piece of a minority segment — a sensitivity worth naming, not a dependence.
Promotional-CEO (X2) and structural-decline (X3) checks are not this tab's to settle; nothing surfaced here contradicts them — revenue is rising, not declining — and they are carried by Self-Help and Durability.
Penumbra fell 25.8% from a $303.76 peak on 19 Feb 2025 to a $225.54 trough on 5 Nov 2025, but that decline was a slow multiple de-rating with no dated adverse trigger — earnings beat consensus every quarter through it — and peak-leg volume rose only 2.07x its pre-peak median, orderly rather than panicked. The drawdown fully round-tripped by December 2025. On 15 Jan 2026 Boston Scientific agreed to acquire the company at $374 a share. At $321.19 today the stock is a merger-arbitrage position, not a fear-repriced compounder.
The drawdown, quantified
Peak (19 Feb 2025)
Trough (5 Nov 2025)
Peak-to-trough
Current (31 Jul 2026)
BSX deal price
Source: peak, trough and depth from fit_features.capitulation_gauge.drawdown (daily price history); deal price from the 15 Jan 2026 merger announcement [1].
The capitulation_gauge records a 25.8% fall over 259 days, from a $303.76 close on 19 February 2025 to a $225.54 close on 5 November 2025. Two features of that window matter more than its depth. First, the peak was itself an earnings-driven spike: the stock closed up 12.0% on 19 February 2025, the session after the Q4 2024 release, so the reference point is a high-water mark, not a settled level. Second, the trough on 5 November 2025 coincided with the Q3 2025 release and reversed immediately — the stock closed up 17.3% the next day and finished November at $293.17. The low was a single-session touch, not a base.
Source: daily price history, data/prices/daily.json; deal price ($374) from the 15 Jan 2026 merger announcement [2].
The fall came in one long leg, not a cliff. From the February peak the stock stepped down through 2025 — $292.84 at end-April, $256.63 at end-June, $227.37 at end-October — punctuated by earnings pops that faded within weeks. It then recovered the entire decline: by 31 December 2025 the close was $310.91, above the February peak. The current $321.19 sits above that peak and 71% up the trailing 52-week range (low $224.84, high $360.00). Measured against where the stock trades now, the drawdown the feature file records is a closed historical episode.
The trigger
There is no dated adverse event behind the 2025 decline. The stock did not gap down on a guidance cut, an earnings miss, a recall, or a regulatory action. Every quarter reported during the fall beat consensus — Q4 2024 EPS of $0.97 against $0.89 (+8.5%), Q1 2025 of $0.83 against $0.67 (+24.5%), and Q2 2025 of $0.86 against $0.82 (+4.7%) — and the shares rose 12.0%, 7.0% and 11.9% respectively on the sessions after those releases. A price that falls while earnings beat and estimates hold is multiple compression, not a fear repricing; the de-rating carried the premium down without a shock to point to. The one contextual drag was China, where the preliminary FY2025 update put reported growth at 17.3–17.5% against 24.7–24.9% excluding the region — a headwind to the reported line, not a dated selling event [3].
The only identifiable, dated event that repriced the stock recently is the opposite of an adverse one. On 15 January 2026 Boston Scientific and Penumbra announced a definitive agreement for Boston Scientific to acquire the company at $374 a share, an enterprise value of roughly $14.5 billion [4]. Each share carries the right to elect $374 in cash or 3.8721 Boston Scientific shares, subject to proration to roughly 73% cash and 27% stock [5]. That is the dated event that moved the tape: the stock closed up 11.8% at $350.49 on 15 January on 9.67 million shares — 13.7x its trailing 50-day average, the largest volume day in its listed history — and made an all-time high of $360.00 later that month.
The fear gauge
Volume through the decline points to orderly repricing, not capitulation. The capitulation_gauge measures peak-leg intensity as the maximum 20-day average volume between the February peak and the November trough, divided by the median daily volume over the 180 days before the peak: that ratio is 2.07x. A genuine washout typically prints a far larger multiple; 2.07x is a modest elevation consistent with a steady bleed rather than forced, emotional selling. The single largest volume prints in this stock — 13.7x on 15 January 2026 and 9.9x back in December 2020 — sit outside the drawdown window entirely; the January spike was the acquisition, not the fall. No session inside the peak-to-trough leg registered as an unusual-volume event of that order.
Who was selling
No reported short interest is available. FINRA returned no reported short-interest position rows for PEN, and no borrow-pressure or public net-short disclosures are on file, so the level and change of shorting through the drawdown cannot be quantified from the record — daily short-sale volume, where it exists, is trading flow and not a substitute. The tab records this as a data gap rather than inferring a short thesis.
What the record does show is a change in the holder base after January 2026. A definitive merger agreement converts the register from fundamental owners toward risk-arbitrage holders, whose position is the spread to the $374 consideration rather than a view on the business. On 6 May 2026 stockholders adopted the merger agreement overwhelmingly — 28,564,786 shares for against 85,334 against, roughly 99.7% of votes cast [6]. Beyond the arbitrage community, there is no disclosed forced or structural seller — no index deletion, fund liquidation, or insider distribution — in the corpus.
Estimates versus price timing
The framework's signature is a price fall that outruns an estimate cut. Penumbra shows a stronger version of the mismatch and a weaker one at once: the price fell 25.8% through 2025 while estimates were not cut at all. Consensus EPS was beaten every quarter of the decline (surprises of +8.5%, +24.5% and +4.7%), and forward numbers rose rather than fell. So the price move did outrun the fundamentals — but downward, against improving estimates, which is de-rating, not a fear discount to a cut number. Since January 2026 the question is moot: with a definitive deal in place the company withdrew forward guidance, and consensus free-cash-flow estimates ($179.9m for FY2025, $173.1m FY2026, $216.1m FY2027) describe a business whose equity value is now set by the merger terms, not by a discounted cash-flow path. The estimates-versus-value arithmetic sits in the Damage Math and Yield tabs.
What the price reflects now
The gap between price and value today is a merger-arbitrage spread, not a dislocation. At $321.19 the stock trades 14.1% below the $374 cash reference and would return 16.4% if the deal closes at that value. That discount is what remains to be earned for bearing deal risk: stockholder approval is already secured, so the open conditions are regulatory — expiration of the U.S. Hart-Scott-Rodino waiting period and antitrust or foreign-investment clearances in certain non-U.S. jurisdictions [7]. The 27% stock component adds a smaller sensitivity to Boston Scientific's own share price. The company itself frames the residual risk plainly: in its Q2 2026 release it flagged "the risk that the pending acquisition by Boston Scientific Corporation will not be completed in the expected timeframe or at all, including the risk that required regulatory approvals will not be obtained," and declined to provide FY2026 guidance or hold a call given the pending deal [8]. The underlying business kept growing through the pendency — Q2 2026 revenue of $390.0 million, up 14.9% year over year [9] — but that growth now accrues to Boston Scientific on close, not to the standalone equity.
Bottom line
There is no qualifying dislocation here in the framework's sense. The one drawdown the record contains was a 2025 multiple de-rating with no dated trigger and muted 2.07x volume, and it has fully round-tripped — the stock trades above its February 2025 peak. The only recent event that repriced the shares is a definitive acquisition at $374, which turns the stock into a risk-arbitrage instrument priced 14.1% below the deal. The temporary-versus-permanent question the framework asks of a fallen compounder does not apply to a company under a binding merger agreement; that reading belongs to the Fit tab.
The near-term earnings hit behind Penumbra's 2025 drawdown was essentially zero — consensus rose and every quarter beat through the 25.8% fall — so the roughly $3.07B of market value it erased had no earnings basis, and the price has since round-tripped in full ($321.19 today, above the $303.76 peak) under a $374 Boston Scientific bid. The one live value question is a modest out-year EPS shave; the temporary-vs-permanent trial split 0.61, contested.
What this tab has to reconcile
The framework's centre asks whether the market treated a small hit to near-term earnings as a large hit to the NPV of all future cash flows. Penumbra is an unusual specimen because that question was posed twice, in opposite directions, and both have largely resolved:
- The 2025 de-rate — a price hit with almost no earnings basis. From a $303.76 peak on 19 Feb 2025 to a $225.54 trough on 5 Nov 2025 the stock fell 25.8% [fit_features:capitulation_gauge.drawdown], erasing ~$3.07B of market cap. Yet through that entire leg consensus rose and every reported quarter beat. That is the classic overreaction setup — and it fully reversed, first by the market (the stock was back above its peak by 31 Dec 2025) and then by a strategic acquirer at $374 [1].
- The 2026 out-year cut — an earnings hit with almost no price effect. The 30 Jul 2026 Q2 print missed on EPS (−14.4%) as SG&A stepped up, and analysts trimmed FY2027/FY2028 EPS while leaving revenue untouched. But the price barely moved: it is anchored 14% below the $374 deal, so the earnings revision has no room to reprice.
Neither episode is a live "small hit, large NPV loss" gap today. The tab below shows the arithmetic behind that conclusion, then hands the residual — is the post-2024 reset a permanent step-down or a timing lull — to the trial, which is where the diagnosis lives.
The numerator: how far did near-term consensus actually fall?
Around the 2025 drawdown, it did not fall — it rose. FY2025 revenue landed at $1,403.7M against a $1,384.4M consensus, and normalized EPS at $3.84 against $3.78; the four quarters reported into and through the fall beat by +8.5%, +24.5%, +4.7% and +6.1%. A near-term estimate that climbs while the price falls 25.8% is the signature of a de-rate, not an impairment — the numerator of any damage calculation over that window is negative.
The only genuine near-term hit came a year later, at the Q2 2026 print (30 Jul 2026), and it landed on margin, not on sales. Q2 EPS of $1.011 missed the $1.182 consensus by 14.4% — the first miss in the series — because SG&A jumped to $391.3M for the half from $313.4M, so first-half operating income fell to $79.3M from $81.2M even as revenue grew 15.3% to $764.8M [2]. Analysts responded by cutting the out-year EPS curve while holding revenue flat:
Source: revision history from data/sp/estimates.json (momentum, 180-day vs current means); revenue in $M, EPS per share.
Revenue held to within a fraction of a percent; normalized EPS was cut 3.5% for FY2027 and 7.2% for FY2028. That is the whole earnings hit — a mid-single-digit shave to the out-year profit curve, top line intact. Note that no near-term guidance offsets it either way: with the deal pending, management withdrew the 2026 outlook and stopped hosting calls [3].
The denominator: the price and EV moves alongside
Peak 19 Feb 2025
Trough 5 Nov 2025
Peak-to-trough
Now 31 Jul 2026
BSX deal price
At 39,291,828 shares [fit_features:market_cap.shares], those prices translate directly into value:
Source: market cap from fit_features.market_cap (shares × close); EV nets ~$427M consensus net cash (data/sp/estimates.json, net_debt FY2025 = −$426.8M). Peak/trough closes from fit_features.capitulation_gauge.
Side by side: consensus near-term earnings did not fall through the 25.8% drawdown, yet the market cap fell $3.07B. The value that vanished at the trough had no arithmetic behind it — and the market agreed within weeks, marking the stock back above its peak.
The NPV arithmetic, two ways
The only earnings damage to capitalize is the out-year EPS shave — FY2028 normalized EPS cut $0.57, from $7.88 to $7.31. I take that as the run-rate hit and run it through two transparent scenarios at a 10% discount rate.
Scenario A — temporary (the cut reverses). Management's own account is that the margin step-down is a completed sales-force build-out, after which "we are positioned to capture sales and operating leverage." If that leverage arrives, the out-year EPS curve re-rates back up and the consensus FCF path — $173M (FY26) → $216M (FY27) → $300M (FY28) — is unimpaired. NPV damage from the near-term hit ≈ $0. Under this reading the entire $3.07B peak-to-trough decline was price damage against zero value damage, and it has already been erased.
Scenario B — permanent (the cut sticks). Treat the $0.57/share FY2028 shave as a durable level shift — $22.4M of annual earning power gone (0.57 × 39.29M shares). Capitalize it:
Workings: annual shave $22.4M ÷ (r − g) for the perpetuities; $0.57 × multiple for the multiple method. Discount rate 10%. FY2028 EPS from data/sp/estimates.json (momentum, 180-day vs current normalized means).
Even the harshest permanent reading destroys ~$0.3–0.5B — roughly 2.5%–3.9% of the current $12.62B cap. Add the already-crystallized Immersive Healthcare wind-down (~$115.3M, $2.93/share, booked in FY2024 and behind the company) and the durable value damage plausibly attributable to the whole episode is on the order of $0.4–0.6B.
The gap
The classic damage-math gap — price overshooting value — is absent at today's price. It existed, and was large, only at the November 2025 trough: a ~$3.07B price hit against a ~$0 near-term earnings hit. That mispricing has been fully arbitraged away, first by the market's own re-rate above the peak and then by Boston Scientific's $374 offer, which values the standalone business 23% above where it peaked before the drawdown [4]. A buyer today is not harvesting a fear-repriced value gap; they are underwriting a 14% merger-arb spread. This is the same read the Dislocation tab reaches from the price side.
The trial: is the post-2024 reset temporary or permanent?
The residual question — whether the 2024 thrombectomy-growth reset and Immersive exit permanently lowered Penumbra's earning-power slope — was tried by two opposing corpus-cited briefs and ruled on by three independent judges. I present each at its strongest; I cannot override the ruling.
The temporary case, at its strongest. The impairment never touched the cash-flow trajectory. At the trough quarter Penumbra raised full-year guidance and grew revenue 17.8% [5]; FY2025 actuals beat across the board; gross margin still expanded, toward a 70% target; the sales-force build that compressed margin is complete; and the forward consensus curve rises — revenue $1,596M → $1,802M → $2,043M and normalized EPS $4.75 → $7.31 out to FY2028. A permanent impairment cannot coexist with a monotonically rising forward curve, and Boston Scientific's $374 bid is external validation that standalone value was intact.
The permanent case, at its strongest. The February 2025 confirmation was that the July 2024 reset was structural, not a timing quarter: FY2024 GAAP operating income fell to $9.3M from $73.6M and 2025 guidance was only 12–14% total growth [6]. The permanence mechanism is lower conversion of revenue to earnings: Penumbra permanently exited Immersive Healthcare; core thrombectomy growth decelerated 20% → 16% → 12.3% (1H26); international mix fell from 28.5% (2023) to 22.2% (2025); and in 1H26 the top line grew 15.3% while operating income fell [7]. The recovery came off a lower base; it did not restore the pre-reset slope, and the out-year EPS cuts are the proof.
The ruling. The judges put the probability the impairment is temporary at 0.61, with a mean of 0.57 and a wide 0.26 spread — the panel is contested. The split is reading-order sensitive: the two judges who read the permanent brief first landed at 0.61 and 0.68, while the judge who read temporary first landed at 0.42, a 0.225 order gap. I present both readings and pick no winner. The diagnosis probability this report carries is the trial's 0.61, not my own.
What would break the tie, per the panel: FY2026 operating income growing faster than revenue (leverage finally arriving after the "build-out complete" claim), thrombectomy re-accelerating back above ~16%, and FY2027/FY2028 revisions turning back up rather than continuing to slip — each would tilt temporary. The mirror conditions — SG&A staying above 50% of revenue, thrombectomy stuck near 12%, international mix stuck at 22% — would confirm permanence.
Which line broke, and whether it self-corrects
The break is narrow and specific: thrombectomy volume growth and SG&A leverage, not price or the top line. Core thrombectomy decelerated from ~20% (FY2024) to 16.2% (FY2025) to 12.3% in the first half of 2026, while embolization and access held up at 21.8% [8]. Pricing was "substantially unchanged," so growth now depends on harder volume conversion, and the embolization sales-force build pushed SG&A to 51% of revenue before the promised leverage appeared. FY2025 still produced $189.2M of operating income on 17.5% revenue growth and a 67.1% gross margin [9] — the engine works; the question is the slope from here.
The self-correction mechanism, if it exists, is operating leverage on a completed cost base plus new-market catalysts (Thunderbolt neuro, STORM-PE, CAVT). The structural case against is that the growth algorithm has permanently reset lower — a decelerating core, a durably U.S.-heavy mix after the international and China resets, and a commercial cost-to-grow that keeps SG&A elevated. The corpus does not resolve which; the trial's 0.61 is as far as the evidence carries, and the $374 deal — should it close at price — would retire the question before FY2026 results can settle it.
Yield
Penumbra generates cash, but not on a scale the price respects. On the framework's basis — reported free cash flow minus stock-based compensation minus the five-year average of cash acquisitions — adjusted FCF was $115.7M in FY2025, a 0.92% yield on the $12.6B market cap. The balance sheet is a fortress (no funded debt), which sets the reference line at roughly 8–9%; the current yield sits about 710–810 bps below it. Consensus forward FCF reaches only ~2.4% by FY2028. There is no path to the bar.
The verdict-bearing yield features arrive as not_computable — the cash-flow data feed carries no stock-based-compensation field, so adjusted FCF, its yield, and the baseline could not be machine-derived. Every figure below is hand-computed from the stock-based-compensation lines in the filed 10-K statements of cash flows and reconciled to the reported free-cash-flow series. The arithmetic is shown line by line.
The adjustment, line by line
Reported free cash flow is operating cash flow less purchases of property and equipment. From it the framework removes stock-based compensation (a real, recurring cost that FCF adds back) and the trailing five-year average of cash spent on acquisitions. Penumbra's acquisitions have been paid in stock, not cash — the 2021 purchase that folded in its immersive-rehabilitation business was settled with $174.1M of common stock and $80.7M of replacement options [1], non-cash consideration that never touches the cash-flow adjustment but does inflate the share count. Cash acquisition outlays across the window are immaterial (a $1.0M asset acquisition in FY2023, sub-$2M acquisition-obligation payments in FY2019–FY2020), so the five-year average rounds to zero.
Adjusted FCF = reported FCF − SBC − 5-yr avg cash acquisitions; derived from company filings. SBC from the Consolidated Statements of Cash Flows: FY2025/24/23 [2], FY2022 [3], FY2021/20/19 [4]; revenue from the Consolidated Statements of Operations [5].
The adjustment is large because SBC is large. In FY2025, stock-based compensation of $59.2M consumes 34% of reported FCF, cutting $174.9M to $115.7M [6]. More telling than any single year is the shape: adjusted FCF was negative in FY2019 through FY2022 and only crossed into positive territory in FY2023. This is a business that reached cash generation recently, not a mature cash machine that stumbled.
The yield, three ways
Reported FCF Yield (FY25)
Adjusted FCF Yield (FY25)
Adjusted FCF Yield (3-yr avg)
Yields on current market cap of $12.6B (39.3M shares at $321.19, 2026-07-31). Reported FCF and SBC per the FY2025 10-K Consolidated Statements of Cash Flows [7]; 3-yr average is adjusted FCF for FY2023–FY2025 ($82.8M).
Current adjusted yield is 0.92%. The three-year average is lower still at 0.66%, because FY2023 adjusted FCF was only $31.6M. At $321.19 the market values Penumbra at roughly 72 times reported FCF and 109 times adjusted FCF.
The company's own history rules out the fortress signature the framework hunts — a stable ~3.5–4% name suddenly repriced to 8–9%. Computing the adjusted yield on each year's then-current market cap (same-year shares at the fiscal-year-end close) shows a series that has never crossed 1.1% and was negative for four straight years:
Adjusted FCF ÷ (same-year shares × fiscal-year-end close); derived from company filings and daily prices. Shares and SBC per the 10-K cash-flow statements [8] [9].
There is no baseline to jump from. Penumbra has traded on a growth multiple its entire public life, so the adjusted yield has hovered near zero throughout — not because the business is broken, but because the price has always embedded years of forward growth. The current 0.92% is the high-water mark of a series that has never approached the reference line.
Which bar applies
The bar is set by the balance sheet. Penumbra carries no funded debt — no term loans, notes, or borrowings appear anywhere in the FY2025 10-K. Against cash and equivalents of $186.9M plus marketable investments of $357.9M ($544.8M of liquid assets), the only balance-sheet liabilities of a debt character are lease obligations totaling $219.7M (operating $196.6M, finance $23.1M) [10].
Source: FY2025 10-K Consolidated Balance Sheets [11].
Net debt is negative whether or not leases are counted: excluding leases, net cash is $544.8M; treating all lease liabilities as debt, net cash is still $325.1M. Against FY2025 EBITDA of roughly $207M (operating income $189.2M plus depreciation and amortization $17.5M), net debt / EBITDA is negative. This is a fortress balance sheet, which selects the ~8–9% reference line.
Stated in plain arithmetic: 0.92% on FY2025 adjusted FCF against the 8–9% fortress bar — about 710 to 810 bps short. Even the unadjusted reported yield of 1.39% clears none of the distance. The gap is not marginal; it is roughly an order of magnitude.
Normalized mid-cycle yield
Penumbra is a secular-growth medical-device maker, not a cyclical, so there is no depressed trough year to normalize back toward a mid-cycle mean. If anything the current-year figure understates a rising margin trajectory rather than a cyclically depressed one — but that is growth, not a cycle. To close a 700-bps gap on FY2025 revenue of $1.40B, adjusted FCF would have to be roughly 8% of sales — near $115M times eight, or over $900M — which no normalization of the current cost base supports. Under any adjacent window (using FY2024 or a 3-year average as the base), the yield lands lower, not higher. Normalization does not rescue this pillar.
The consensus check
Consensus provides free-cash-flow estimates directly (the closest available proxy; these are pre-SBC reported FCF, not the framework's adjusted basis). On the current $12.6B market cap they clear nothing:
Consensus free-cash-flow means as of 2026-08-03; approximate adjusted yield subtracts ~$60M expected SBC. Source: CapIQ estimates (data/sp/estimates.json).
Consensus forward FCF rises from $173M (FY2026) to $300M (FY2028), yet even the FY2028 figure yields only 2.38% on today's cap — and under 2% once SBC is netted out. The sell side is not scared here; it agrees Penumbra is a fast-growing, richly valued device company, and prices it accordingly. That is the opposite of the framework's strong setup, where consensus forward FCF also clears the bar and the buy side is merely fearful.
Because consensus never approaches the ~8–9% line, no mean-reversion underwrite is available. Reaching an 8% adjusted yield at the current market cap would require roughly $1.0B of adjusted FCF against the ~$115M produced in FY2025 — a near-ninefold increase — or a commensurate fall in price. The probability of the yield reaching the bar within one to three years through cash-flow growth alone is effectively nil; the mechanism does not exist on that horizon. The stock currently trades at $321.19, above its February-2025 peak, so the modest 2024–25 drawdown detailed in Dislocation has already reversed — there is no live fear discount to reprice.
FCF-to-revenue conversion
The one genuinely favorable reading is conversion, which is improving, not deteriorating. Reported FCF margin swung from negative in FY2020–FY2022 to 12.5% in FY2025; the adjusted margin reached 8.2%.
Reported and adjusted FCF ÷ revenue; derived from company filings [12] [13].
Improving conversion is a point in the durability column, examined further in Durability. But it cuts against a yield case rather than for one: rising margins on 17%-plus revenue growth are exactly what the market has already paid 72 times FCF to own. The yield fails not because the cash flow is weak or unstable, but because the price is high.
Source: Penumbra FY2025 Form 10-K, company cash-flow filings, FTC/merger disclosures · Generated 2026-08-03.
Durability — the year-10 question
The framework's one binary gate asks whether year-10 revenue and year-10 adjusted free cash flow will be higher than today's, with very high conviction. For the underlying thrombectomy business the revenue leg holds with room to spare: Penumbra sells the standard-of-care intervention for acute clot disease into a market that is still mostly untreated, and revenue has compounded for a decade [1]. The adjusted-FCF leg is probable but genuinely younger — positive free cash flow is three years old, and the competitive field is consolidating. Above both sits the fact that decides how a decade-holder should read this name: a definitive Boston Scientific merger at $374 per share [2]. There is no standalone Penumbra to own in year 10.
The pending acquisition frames everything
On 14 January 2026 Penumbra signed an Agreement and Plan of Merger with Boston Scientific at an enterprise value of approximately $14.5 billion, valuing each share at $374 — payable, at the holder's election and subject to proration, as $374 in cash or 3.8721 Boston Scientific shares, so that total consideration is roughly 73% cash and 27% stock [3]. The merger agreement carries a $525.0 million company termination fee and prohibits Penumbra from soliciting competing bids [4]. The transaction is not a formality: on 16 March 2026 both parties received a Second Request from the U.S. Federal Trade Commission, extending the HSR waiting period, and the deal also requires European Union and other non-U.S. competition clearances; Boston Scientific owes a $900 million reverse termination fee if regulatory approvals fail. Management now expects a close in the second half of 2026.
Deal price / share ($)
Enterprise value ($B)
Last close 31-Jul-26 ($)
Discount to deal price
Source: merger terms from FY2025 10-K p.8; last close from data/prices/daily.json (31-Jul-2026). Spread = (374 − 321.19) / 374.
The stock closed at $321.19 on 31 July 2026 — about 14% below the $374 cash-equivalent price [5]. That gap is the market pricing antitrust and timing risk, not a discount to intrinsic value. For Ruchir's system, which buys durable cash generators to hold for a decade, a company under a signed cash-and-stock acquisition is a merger-arbitrage position rather than a compounder: the security is on a path to being extinguished within a year, whatever the business is worth. The durability of the business is assessed below, because it is what the FTC, and any decade-holder, is ultimately weighing.
The conviction sources, one at a time
Market structure — an oligopoly of giants around a focused leader. Penumbra describes itself as "the world's leading thrombectomy company" [6], and its named competitors are the largest device makers alive: "Boston Scientific, Medtronic, Stryker (now including Inari Medical), Terumo and several private companies," most "large, well-capitalized companies with longer operating histories and greater resources" [7]. This is an oligopoly, but not one where Penumbra holds monopoly pricing power — it is a focused innovator competing against diversified balance sheets many times its size. Share has been stable-to-rising, evidenced by a decade of growth that outpaced the market (below), but the structure confers no protected franchise. Graded for this company: real, but a competitive oligopoly rather than a moat of scale.
Regulatory and IP entry barriers — genuine and specific. Every product clears the FDA through the 510(k) or premarket-approval pathway, with most Class III devices requiring a PMA [8]. Penumbra also owned or had rights to 125 issued patents (66 U.S.) at year-end 2025, and its computer-assisted-vacuum-thrombectomy patents run to 2039-2044 [9] — a durable IP runway on its core growth platform. But the barrier that matters most is the evidence: reversing the stroke-care pathway toward intervention rests on "substantial clinical data," and building that record takes years [10]. That raises the cost of entry for a new competitor — but the FDA pathway and clinical franchises protect the incumbents collectively, not Penumbra uniquely, since Medtronic and Stryker carry the same.
Capital intensity as a moat — does not apply. Penumbra is not asset-heavy in the utility or network sense. Property-and-equipment purchases ran $63.7 million in 2025 against $1.4 billion of revenue [11]; the durable assets are intellectual property, the clinical-evidence base, the direct salesforce and physician relationships — replicable with capital and time, not a replacement-cost barrier. This conviction source is absent.
Essentialness — strong. The products treat ischemic stroke, pulmonary embolism and acute limb ischemia — conditions where the alternative to intervention is death or permanent disability, and where "the vast majority" of the roughly 2.15 million annual U.S. clot incidences still receive no mechanical thrombectomy [12]. Demand is acute and non-deferrable, which showed through the pandemic: revenue still rose in 2020, the year elective procedures collapsed. This is the strongest of the conviction sources.
Operating history — established, but young as a cash generator. Penumbra was founded in 2004, has sold thrombectomy products since 2007, and IPO'd in 2015 [13]. Twenty-one years of operations and a decade of unbroken revenue growth is a real track record. But the company only turned consistently free-cash-flow positive in 2023 — the survival-through-cycles evidence is on the top line, not yet on the cash line.
The market is mostly untreated — the revenue runway
The demand case rests on penetration, not share gains. Of the roughly 700,000 ischemic strokes in the U.S. each year, Penumbra estimates about 200,000 are treatable with mechanical thrombectomy — and only a fraction are treated today [14]. Internationally it estimates about 9.7 million ischemic strokes annually, 1.9 million of them thrombectomy-treatable [15]. The thrombectomy category — 68% of 2025 revenue at $947.9 million — is also the faster-growing half, up 16% on the year [16].
Source: total revenue = U.S. + international revenue from company filings (data/financials/segment.json); 2019-2025 anchored to filed 10-Ks — FY2021 10-K p.8 ($547.4M/$560.4M/$747.6M) and FY2025 10-K p.8 ($1,058.5M/$1,194.6M/$1,403.7M).
The structural threats, hunted
Competitive consolidation — the most concrete threat. Stryker's acquisition of Inari Medical folds a scaled peripheral- and venous-thrombectomy franchise into a competitor that already sells neurovascular devices, and Penumbra now names "Stryker (now including Inari Medical)" as a most-notable competitor [17]. Boston Scientific — the acquirer — and Medtronic compete directly in the same categories, and Johnson & Johnson (Cerenovus) is a neurovascular player. These rivals "may be able to spend more on product acquisition, development, marketing" [18]. The year-10 impact is not obsolescence — mechanical thrombectomy is itself the disruptive technology displacing drug-only treatment — but pricing and share pressure in a category where three companies larger than Penumbra are investing hard. This is the threat most likely to bend the FCF curve.
Reimbursement and pricing pressure — real, chronic, bounded. Payors can deny reimbursement for devices deemed not cost-effective, and cost-containment programs "could potentially limit the amount which healthcare providers may be willing to pay" [19]. Penumbra's counter is that its products are cost-effective versus the alternative of a disabling stroke, which supports coverage; the pressure is a persistent margin headwind rather than a demand threat.
Technology substitution — Penumbra is on the right side of it. The obsolescence risk the 10-K flags is that "existing products may be rendered obsolete" by faster-iterating rivals [20]. But the secular shift — from tissue-plasminogen-activator drug therapy toward mechanical clot removal — runs in Penumbra's favor; the substitution risk is within-category (a competitor's better aspiration catheter), not a technology that makes thrombectomy itself obsolete. No margin here reads as an "Amazon opportunity" for a disruptor from outside the category.
Customer concentration and China — not material. Roughly 90% of 2025 revenue was direct sales to a diffuse hospital base, with no single-customer dependence, and China is handled through fixed-payment technology licenses rather than direct exposure — a structure explicitly designed to "mitigate market risk" [21]. These common exclusion triggers do not apply.
A capital-allocation misfire on record. In 2024 Penumbra wound down its immersive-healthcare (virtual-reality rehabilitation) business, taking $115.3 million in impairment and other charges [22]. Execution is not a moat, and the flip side is that a failed adjacency shows the year-10 FCF depends on management deploying capital well — a judgment the record does not yet fully vindicate.
The disqualifier check — no structural decline
The framework's hard exclusion (X3) is three consecutive fiscal years of high-single-digit revenue decline. Penumbra fails it in the opposite direction: revenue rose in all ten years on record, including the pandemic year 2020 (+2.4%). The deterministic feature file records three_year_hsd_decline = false and consecutive_decline_years = 0, matching the reconstructed history above [23]. There is no structural-decline evidence to state; the flag is clean.
FCF consistency (P2) — positive, but only recently
Here the picture is genuinely two-sided. Reported free cash flow was negative or near-zero in six of the ten years through 2022, then inflected sharply — $82.1 million in 2023, $147.3 million in 2024, $174.9 million in 2025 [24].
Source: free cash flow = operating cash flow − purchases of property and equipment, from company cash-flow filings (data/financials/cash_flow.json); 2023-2025 anchored to FY2025 10-K p.131.
The profile's fit_features.fcf_stability returns not_computable — a rolling five-year adjusted-FCF average needs five consecutive adjusted-FCF years, and adjusted FCF is itself unavailable in the feed for want of stock-based-compensation data [fit_features: fcf_stability]. That gap is recoverable by hand: stock-based compensation is disclosed on the cash-flow statement — $50.5M (2023), $46.2M (2024), $59.2M (2025) — and acquisitions are effectively nil [25]. Subtracting them gives adjusted FCF of about $31.6M (2023), $101.1M (2024), $115.7M (2025) — positive and rising, but a three-year series, not a stable one.
| Fiscal year | Reported FCF | − Stock-based comp | = Adjusted FCF |
|---|---|---|---|
| 2023 | $82.1M | $50.5M | ~$31.6M |
| 2024 | $147.3M | $46.2M | ~$101.1M |
| 2025 | $174.9M | $59.2M | ~$115.7M |
Adjusted FCF = reported FCF − stock-based compensation − 5-yr average acquisition spend (≈$0; Penumbra is organic); derived from FY2025 10-K p.131. Recomputed by hand because fit_features.adjusted_fcf is not_computable (SBC absent from the feed).
The negative episodes are not a business-model cadence. This is not an insurance or banking book with a 5-8 year underwriting cycle; it is a one-directional curve — a growth company that invested through cash breakeven and is now harvesting operating leverage, with income from operations rising from $6.1M (2022) to $9.3M (2024) to $189.2M (2025) [26]. Under a strict reading of P2, the long history is not consistent; under a forward reading, the mechanism behind the inflection (scale over a largely fixed cost base) is durable. Both are true.
The year-10 case, both ways
The strongest case that both are higher. Revenue: the standard-of-care shift toward mechanical thrombectomy is early — roughly 200,000 U.S. strokes are treatable and only a minority are treated, with a far larger international pool [27] — and Penumbra has grown revenue every year for a decade at roughly 20% compound. Adjusted FCF: gross margin runs about 67%, the balance sheet carries no debt, and operating income has stepped up an order of magnitude as revenue scaled, so a business this much larger in a decade should generate more cash, not less.
The strongest doubt. Year-10 revenue-higher is a high-conviction call; year-10 adjusted-FCF-higher is the softer leg. Positive adjusted FCF is only three years old, so the "very high conviction" the gate demands rests on a short record. Three competitors larger than Penumbra — Boston Scientific, Medtronic and a newly enlarged Stryker/Inari — are investing in the same categories, and the one capital-allocation test on record (immersive healthcare) cost $115.3 million and failed [28]. A decade of pricing pressure and share competition could hold FCF flat even as revenue rises.
The read. For the business, the revenue gate holds with very high conviction, and the adjusted-FCF gate probably holds — but the FCF leg carries a genuine doubt the framework treats as disqualifying at the "very high conviction" threshold: three years of positive cash flow is too short a base to be certain against intensifying competition. What would settle it is two or three more years of the 2023-2025 FCF trajectory sustained through the Stryker/Inari competition. That test will not run on this security, because the definitive Boston Scientific merger at $374 per share removes the standalone decade entirely — the durable business is being folded into a larger one, and there is no year-10 Penumbra equity to hold.
Penumbra can outlast almost any problem: no borrowings, roughly $545 million of cash and marketable investments, an all-lease liability stack. But the buyback flywheel this pillar looks for is absent. The share count has risen every year on $46–59 million of annual stock compensation, the only sizeable repurchase was a single $100 million block in 2024, and a signed Boston Scientific takeout at $374 now bars further buybacks. Management's record shows one guidance miss, acknowledged and corrected.
The self-rescue question has already been answered by a buyer
On January 14, 2026, Penumbra signed an Agreement and Plan of Merger to be acquired by Boston Scientific at $374 per share — an enterprise value of about $14.5 billion, with holders electing cash or 3.8721 Boston Scientific shares subject to proration (roughly 73% cash, 27% stock), expected to close by the end of 2026 [1]. That fact reframes this entire pillar. The framework asks whether a company can rescue its own shareholders through repurchases at a moment of maximum fear; here the company has instead agreed to sell itself, at a price above where it has ever traded.
The merger also freezes the one lever this tab measures. Under the agreement, Penumbra "[is] not permitted to repurchase shares of [its] common stock without the prior approval of Boston Scientific" and is barred from incurring indebtedness or making unbudgeted capital expenditures while the deal is pending [2]. A $525 million termination fee sits behind the agreement should Penumbra walk to a competing bid [3]. At the $321.19 close used for this report, the stock trades about 16% below the $374 consideration — a merger-arbitrage spread, not a fear-driven dislocation.
The rest of this tab establishes the underlying balance sheet and capital-allocation record on their own terms, because they decide the framework question regardless of the deal.
The balance sheet against the problem's duration
Penumbra carries no debt. On the Q3 2024 call, before any of the current issues, management described "a cash, cash equivalents, and marketable security balance of $291 million and no debt" [4]. At the FY2025 year-end the liquid position had grown: $186.9 million of cash and equivalents plus $357.9 million of marketable investments, about $545 million in all, against total liabilities of $398.9 million that consist entirely of payables, accruals, and lease obligations — there are no borrowings on the balance sheet [5].
Because there is no debt, there is no maturity wall to refinance and no covenant that could force capital toward paydown. The only contractual maturities are leases, and they are spread evenly across the next decade:
| Year | Operating lease payments ($K) | Finance lease payments ($K) |
|---|---|---|
| 2026 | 23,536 | 3,590 |
| 2027 | 23,123 | 3,438 |
| 2028 | 22,783 | 3,384 |
| 2029 | 22,691 | 3,223 |
| 2030 | 23,055 | 3,025 |
| Thereafter | 142,237 | 12,350 |
| Total undiscounted | 257,425 | 29,010 |
Source: FY2025 Annual Report (Form 10-K), lease maturities footnote [6].
Roughly $27 million of lease payments a year against $238.7 million of operating cash flow in FY2025 is immaterial to solvency [7]. On the first pillar question — can the company comfortably outlast a problem without capital allocation being forced toward debt paydown — the answer is unambiguously yes. The constraint on repurchases is not the balance sheet; it is the merger and, before it, management's own choice.
The repurchase record — one block, against a rising share count
The self-help engine requires a shrinking share count. Penumbra's has moved the other way in every year of its public life, from 33.5 million shares in FY2016 to 39.3 million in FY2025 — a compound rise of about 1.9% a year over the last five [8].
Source: diluted weighted shares from the FY2025 10-K statement of operations and prior filings [9]; buyback cash from fit_features.share_count_trend.
The cause is stock-based compensation, not acquisitions. Penumbra expensed $50.5 million of SBC in FY2023, $46.2 million in FY2024, and $59.2 million in FY2025, and issues shares each year through option exercises and the employee purchase plan [10]. Even in FY2024 — the one year with a repurchase — gross issuance of about 327,000 shares from options and the purchase plan offset part of the 517,763 shares retired. In FY2025 the company issued about 739,000 shares and bought back none. A share count that keeps rising on stock compensation is the specific pattern the framework excludes from the self-help pillar; the record here shows it plainly.
The single repurchase was opportunistic and small. Under a $200 million authorization approved on August 5, 2024, Penumbra entered one accelerated share repurchase and bought 517,763 shares for an aggregate $100.4 million — roughly $194 a share — during the third quarter of 2024 [11]. Nothing has been repurchased since; the remaining $100 million of authority was extended to December 31, 2026 but sits unused, and is now subject to Boston Scientific's approval [12]. The one price paid, ~$194, looks favorable against today's $321 and the $374 deal, but a single block does not make a repurchase engine.
Buyback intent, from the calls
The transcript record contains no management commitment to repurchases as a capital-return priority. Across the recent quarterly calls, brokers pressed on Thunderbolt's FDA timing, the STORM-PE readout, stroke-market softness, and the path to a 70% gross margin — not on capital allocation. The only capital-return event discussed was the 2024 block, framed as a one-time deployment of surplus cash rather than the start of a program: management noted operating cash "before you include the impact of our $100 million stock buyback," treating it as a discrete event [13]. This is a growth-reinvestment company — capital goes to R&D, the sales-force build-out, and manufacturing — and management has never presented a buyback flywheel as part of the story.
The absurdity check
The framework's absurdity check asks how many years of adjusted free cash flow would retire the entire float at the current price; a dislocation deep enough to matter implies something like three. Penumbra sits at the opposite extreme. FY2025 free cash flow was $174.9 million (operating cash $238.7 million less $63.7 million of capital expenditure) [14]. Against the $12.62 billion market value in this report, that raw figure retires the float in about 72 years. Subtracting the $59.2 million of stock compensation to reach an adjusted figure of roughly $116 million pushes the number to about 109 years; at the $374 deal price the equity is larger still. The price is not making a claim that cannot survive — it is a growth-and-takeout multiple, the inverse of the deep-value setup this check is built to catch.
The deterministic feature file reports adjusted_fcf and float_retirement_years as not_computable because the automated cash-flow feed omitted stock compensation; the figures above are derived by hand from the filed FY2025 statement of cash flows, where SBC is $59.2 million (recorded in data gaps).
Dividend
Penumbra has never declared or paid a cash dividend and does not anticipate one; the dividend is no part of the return case [15].
Management credibility
Penumbra's promise-versus-delivery record over the last two years shows one clear miss, acknowledged and corrected, rather than a pattern of over-promising.
| Promise (call) | What happened |
|---|---|
| FY2024 revenue $1.230–1.270B, +16–20%, U.S. thrombectomy +27–30% (Q4 2023) | Cut mid-2024; FY2024 revenue landed near $1.195B, thrombectomy +26.8% — a miss on the original guide |
| Reset FY2024 guide $1.180–1.200B (Q2 2024) | Held; FY2024 came in at the top of the reset range |
| FY2025 initial guide $1.340–1.360B (Q4 2024) | Raised every quarter; FY2025 revenue was $1.404B, above even the raised guide |
| 70% gross margin by end of 2026 (standing target) | On track — 67.8% by Q3 2025; milestone still ahead |
Source: guidance quotes and outcomes from the FY2023–FY2025 earnings calls and the FY2025 10-K statement of operations [16]; [17]; [18].
The single stumble was the early-2024 over-optimism, which management answered with an explicit conservatism it has since kept: "Going forward, our guidance will reflect a comfortable level of conservatism" [19]. A year later it still invoked the miss as a self-check, saying it had "fresh memories of having our enthusiasm get the better of us" [20]. Through the rest of 2025 the company beat and raised. This is not the promotional, serial-miss profile the framework excludes.
Insider economic ownership is modest for a founder-led company. Co-founder, Chairman and CEO Adam Elsesser beneficially owns 760,042 shares, 1.9% of the company; all directors and executive officers together hold 1,139,814 shares, 2.9% [21]. The Form 4 record shows no open-market insider purchases and recent dispositions including a 77,000-share gift by the CEO in May 2026. Ownership is real but not large; combined with a 22-year operating history and a corrected guidance record, it does not meet the promotional-CEO exclusion.
Penumbra is not a dislocated compounder waiting to re-rate. It is a company under a definitive agreement to be acquired by Boston Scientific at $374 per share, signed January 14–15, 2026 and expected to close in the second half of 2026. The gap that closes is a merger-arbitrage spread — $321.19 to $374, about 16% gross — not a multi-year recovery. The name's own history of 52–63% drawdowns no longer governs; the deal, now in an FTC Second Request, does.
The clock is a merger, not a cycle
The event that re-recognizes value here is already named, priced, and dated. On January 14, 2026 Penumbra signed an Agreement and Plan of Merger under which Boston Scientific acquires the company, valuing each share at $374 and the enterprise at roughly $14.5 billion [1]. Holders elect, per share, either $374 in cash or 3.8721 Boston Scientific shares, with proration to roughly 73% cash and 27% stock [2], [3]. Chief executive Adam Elsesser has said he will take all stock and join Boston Scientific's board on close [4]. The transaction is subject to Penumbra stockholder approval and customary regulatory clearances, and the parties expect to complete it in 2026 [5].
The spread is the whole re-rating. At $321.19 (July 31, 2026) against $374 of deal consideration, the gross spread is $52.81, or 16.4% to deal value — and unlike a cycle repricing, its timing is governed by a regulatory calendar rather than by earnings. The market's reaction on announcement was the largest volume day in Penumbra's listed history: 9.67 million shares on January 15, 2026, roughly ten times its trailing pace, lifting the stock from $313.43 the prior close to $350.49. That volume spike is a deal-repricing event, the mirror image of the forced, fear-driven capitulation this framework hunts.
| Date | Event | Bearing on the clock |
|---|---|---|
| Jan 14, 2026 | Merger Agreement signed at $374/share, ~$14.5B EV | Fixes the payout; caps upside at deal value |
| Jan 15, 2026 | Deal announced; stock $313 → $350 on 9.7M shares | Re-rating already largely absorbed |
| Mar 16, 2026 | FTC issues Second Request (HSR waiting period extended) | Pushes close later, widens the spread |
| ~H2 / year-end 2026 | Expected close, pending clearances + stockholder vote | The re-recognition date, inside 18 months |
| Nov 4, 2026 | Q3 2026 earnings (no guidance issued pending deal) | Secondary; numbers subordinate to the deal |
Sources: merger terms and timing from the Q2 FY2026 10-Q merger note [6] and the January 15, 2026 announcement [7], [8]; price and volume from the run's daily price series; FTC Second Request (March 16, 2026) from Boston Scientific's Form S-4 / 424B3 registration statement and contemporaneous reporting.
The FTC Second Request, received March 16, 2026, is the live variable in the timing. It extends the HSR waiting period until both parties substantially comply, and it is why the close guidance moved to the second half of 2026. Reporting on the deal notes limited direct product overlap between the two companies, which bears on — but does not decide — the antitrust path; European Union and other non-U.S. competition and foreign-investment clearances also apply. Since the Second Request, the spread has widened rather than tightened: the stock drifted from $350 in late January to $321 by end-July, so the market now discounts the $374 outcome by more than it did on signing — a function of the lengthening timeline and of the 27% stock portion's exposure to Boston Scientific's own share price.
Base rates from Penumbra's own history
Penumbra has been a volatile compounder since its 2015 IPO, and its price has swung far more than its business. Its two deepest drawdowns are the relevant reference points — and both took two to two and a half years to complete a round trip.
Source: derived from the run's daily closing-price series, 2015-09-18 to 2026-07-31; an episode is a peak-to-trough close decline of 25% or more, measured to the first close back above the prior peak.
Source: derived from the run's daily closing-price series; round-trip is peak date to the first close reclaiming that peak.
Two features matter for the clock. First, the deep episodes are slow: the 2021 top ($311, April 2021) did not fully recover until May 2023, about 24 months; the 2023 top ($344, June 2023) troughed at $164 in August 2024 and did not reclaim its high until January 2026, roughly 31 months. A quality franchise that swings 50–63% and takes two-plus years to round-trip is exactly the kind of instrument the framework's 18-month horizon is built for — in the ordinary case. Second, and decisively here, that last round trip was completed by the takeover, not by operating recovery: the day before the deal the stock was $313.43, still 9% below its 2023 high; the merger pop carried it across. The most recent deep drawdown did not heal on its own.
The present decline is not one of these episodes. From the January 27, 2026 high of $359.40 — itself a deal-inflated level — the stock is down 10.6% to $321.19. That is not a fear-driven dislocation; it is the merger-arbitrage spread widening after the FTC Second Request. On operating fundamentals the company is still growing: Q2 2026 revenue was $390.0 million, up from $339.5 million a year earlier (+14.9%), and first-half revenue was $764.8 million against $663.6 million [9]. The current episode therefore has no precedent in Penumbra's history as a dislocation, because it is not one.
The 18-month test
Re-recognition here is expected within roughly six months, not eighteen: Boston Scientific and Penumbra guide to a 2026 close [10], and second-half completion is well inside the framework's window. But what gets "recognized" is capped: $374 in cash-or-stock, a defined outcome, not a multi-year compounding recovery. The path does not require cycle repair; it requires the deal to close — stockholder approval plus clearance of the FTC Second Request and the EU and other non-U.S. reviews. The read, stated once: this is a defined-payout merger on a regulatory clock, and the clock runs to a ceiling, not to a re-rating. What would falsify it is the deal failing to fire — the FTC or a foreign regulator blocking or forcing remedies that break economics, or stockholders rejecting the vote — which would return the stock toward its undisturbed pre-announcement level near $313 (January 14, 2026), and plausibly lower given the negative signal; its trailing-12-month low was $224.84. That deal-break case is the entry in the falsifier ledger this tab owns.
What consensus expects
The sell side is not capitulated — it is anchored to the takeout. Analyst price targets cluster at the deal: a mean of $361.58 and a median and high of $374, against a low of $320 that sits essentially at the current price (consensus of 13 analysts; source: run estimates feed). The spread of targets is the spread of the deal: $374 if it closes, roughly today's price if the market simply holds it pending the vote. That is the opposite of the capitulated, target-slashed positioning the framework looks for — no one is pricing distress; the tape is pricing a takeout with a discount for time and regulatory risk.
Consensus does not need a printed quarter to recognize value here; it needs a closing. Penumbra issued no forward guidance on its Q2 2026 report specifically because of the pending transaction, and the next print — Q3 2026, around November 4, 2026 — is subordinate to the deal calendar. The candidate quarter for "recognition" is not an earnings date at all; it is the close.
Instrument facts
Penumbra is an optionable NYSE large-cap ($12.6 billion market capitalization), so listed options, including longer-dated series, exist on the name. Two facts qualify that. First, the pending cash-and-stock merger has collapsed volatility: 30-day realized volatility was about 5.7% on July 31, 2026, near the lowest reading in the name's history (its historical band runs from roughly 5% to 91%, with a median near 37%) — the signature of a stock pinned to a fixed deal price rather than trading on its fundamentals. Second, a current implied-volatility level, and the detail of any long-dated option chain, were not verifiable from available public sources — the options-data pages checked returned access-denied responses. Consistent with this guide's discipline: long-dated option-implied-volatility data was not verifiable from available sources, and no IV figure is estimated here.
Source: 30-day realized volatility and its historical band from the run's technical-analysis feed (volatility series, as of 2026-07-31); market capitalization from the run's market-cap derivation.
The framework's own consequence follows as a fact, not advice. A name whose price is governed by a $374 takeout expected to close within the year is a defined-outcome situation with volatility already extinguished — a merger spread, not the fear-driven dislocation in an essential compounder that this system underwrites over an 18-month-plus horizon. On that basis the framework routes Penumbra to the watchlist rather than the book. The related evidence sits in the drawdown anatomy (Dislocation), the damage arithmetic (Damage Math), and the framework-fit summary (Fit).